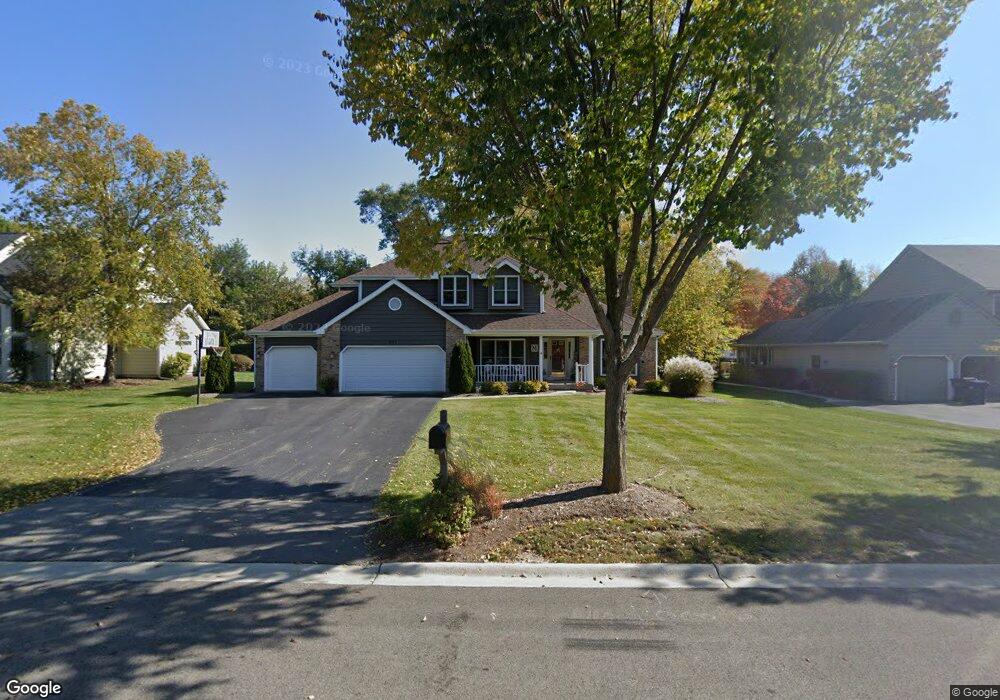
621 Greens View Dr Algonquin, IL 60102
Far West Algonquin NeighborhoodEstimated Value: $510,695 - $635,000
4
Beds
3
Baths
2,459
Sq Ft
$222/Sq Ft
Est. Value
About This Home
This home is located at 621 Greens View Dr, Algonquin, IL 60102 and is currently estimated at $544,674, approximately $221 per square foot. 621 Greens View Dr is a home located in McHenry County with nearby schools including Westfield Community School, Lincoln Prairie Elementary School, and Harry D Jacobs High School.
Ownership History
Date
Name
Owned For
Owner Type
Purchase Details
Closed on
Nov 30, 1999
Sold by
Testerman Donald J and Testerman Jacqueline
Bought by
Mcbride Jon D and Mcbride Tracey L
Current Estimated Value
Home Financials for this Owner
Home Financials are based on the most recent Mortgage that was taken out on this home.
Original Mortgage
$246,600
Outstanding Balance
$76,266
Interest Rate
7.7%
Estimated Equity
$468,408
Purchase Details
Closed on
Nov 1, 1994
Sold by
Phh Homequity Corp
Bought by
Testerman Donald J and Testerman Jacqueline
Home Financials for this Owner
Home Financials are based on the most recent Mortgage that was taken out on this home.
Original Mortgage
$110,000
Interest Rate
8.91%
Purchase Details
Closed on
Aug 16, 1994
Sold by
Sanchez Louie F and Sanchez Hope
Bought by
Phh Homequity Corp
Create a Home Valuation Report for This Property
The Home Valuation Report is an in-depth analysis detailing your home's value as well as a comparison with similar homes in the area
Home Values in the Area
Average Home Value in this Area
Purchase History
| Date | Buyer | Sale Price | Title Company |
|---|---|---|---|
| Mcbride Jon D | $274,000 | 1St American Title | |
| Testerman Donald J | $403,333 | -- | |
| Phh Homequity Corp | -- | -- |
Source: Public Records
Mortgage History
| Date | Status | Borrower | Loan Amount |
|---|---|---|---|
| Open | Mcbride Jon D | $246,600 | |
| Previous Owner | Testerman Donald J | $110,000 |
Source: Public Records
Tax History
| Year | Tax Paid | Tax Assessment Tax Assessment Total Assessment is a certain percentage of the fair market value that is determined by local assessors to be the total taxable value of land and additions on the property. | Land | Improvement |
|---|---|---|---|---|
| 2024 | $11,233 | $151,599 | $29,728 | $121,871 |
| 2023 | $10,680 | $135,586 | $26,588 | $108,998 |
| 2022 | $10,641 | $130,083 | $26,737 | $103,346 |
| 2021 | $10,221 | $121,188 | $24,909 | $96,279 |
| 2020 | $9,958 | $116,898 | $24,027 | $92,871 |
| 2019 | $9,723 | $111,886 | $22,997 | $88,889 |
| 2018 | $9,108 | $101,559 | $21,244 | $80,315 |
| 2017 | $8,930 | $95,675 | $20,013 | $75,662 |
| 2016 | $8,805 | $89,734 | $18,770 | $70,964 |
| 2013 | -- | $92,043 | $17,510 | $74,533 |
Source: Public Records
Map
Nearby Homes
- 3520 Bunker Hill Dr
- 16 Springbrook Ln
- 4241 Wanderlust Dr
- 940 Treeline Dr
- 531 Alpine Dr
- 3650 Wintergreen Terrace
- 895 Eineke Blvd
- 121 Boulder Dr
- 4 Greenbrier Ct
- 2956 Harnish Dr
- 1453 Millbrook Dr
- 432 Thunder Ridge
- 212 Rhinebeck Way
- 320 Boulder Dr
- 1552 Matthew Dr Unit 1552
- 2602 Amber Ln Unit 49
- 1157 Sawmill Ln
- 325 Stonegate Rd Unit 1
- 9105 Algonquin Rd
- 4051 Willow View Dr
- 611 Greens View Dr
- 631 Greens View Dr
- 601 Greens View Dr
- 670 Saratoga Cir
- 650 Saratoga Cir
- 612 Greens View Dr
- 622 Greens View Dr
- 640 Saratoga Cir
- 641 Greens View Dr
- 602 Greens View Dr
- 680 Saratoga Cir
- 531 Greens View Dr
- 632 Greens View Dr Unit 2
- 532 Greens View Dr
- 630 Saratoga Cir
- 661 Saratoga Cir
- 521 Greens View Dr
- 642 Greens View Dr
- 671 Saratoga Cir
- 522 Greens View Dr
Your Personal Tour Guide
Ask me questions while you tour the home.