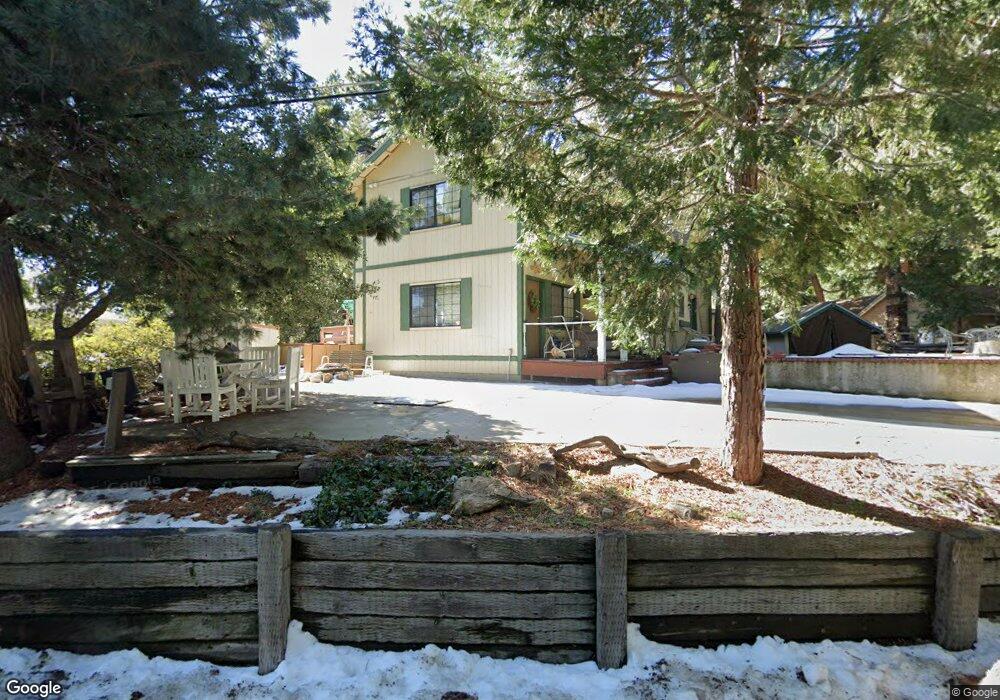
621 Mozumdar Dr Crestline, CA 92325
Estimated Value: $317,000 - $393,426
3
Beds
2
Baths
2,192
Sq Ft
$165/Sq Ft
Est. Value
About This Home
This home is located at 621 Mozumdar Dr, Crestline, CA 92325 and is currently estimated at $362,357, approximately $165 per square foot. 621 Mozumdar Dr is a home located in San Bernardino County with nearby schools including Valley Of Enchantment Elementary School, Mary P. Henck Intermediate School, and Rim Of The World Senior High School.
Ownership History
Date
Name
Owned For
Owner Type
Purchase Details
Closed on
Feb 23, 2016
Sold by
Deutsche Bank National Trust Company
Bought by
Craig John Robert and Steiger Polston Kathleen M
Current Estimated Value
Home Financials for this Owner
Home Financials are based on the most recent Mortgage that was taken out on this home.
Original Mortgage
$133,000
Outstanding Balance
$105,227
Interest Rate
3.72%
Mortgage Type
New Conventional
Estimated Equity
$257,130
Purchase Details
Closed on
Apr 24, 2015
Sold by
Carnell Gary J
Bought by
Deutsche Bank National Trust Company
Purchase Details
Closed on
Mar 8, 2006
Sold by
Duke Lance N
Bought by
Carnell Gary J and Carnell Rachel M
Home Financials for this Owner
Home Financials are based on the most recent Mortgage that was taken out on this home.
Original Mortgage
$256,000
Interest Rate
7.12%
Mortgage Type
Purchase Money Mortgage
Create a Home Valuation Report for This Property
The Home Valuation Report is an in-depth analysis detailing your home's value as well as a comparison with similar homes in the area
Home Values in the Area
Average Home Value in this Area
Purchase History
| Date | Buyer | Sale Price | Title Company |
|---|---|---|---|
| Craig John Robert | $140,000 | First American Title Company | |
| Deutsche Bank National Trust Company | $182,026 | Accommodation | |
| Carnell Gary J | $320,000 | Ticor Title Company |
Source: Public Records
Mortgage History
| Date | Status | Borrower | Loan Amount |
|---|---|---|---|
| Open | Craig John Robert | $133,000 | |
| Previous Owner | Carnell Gary J | $256,000 |
Source: Public Records
Tax History Compared to Growth
Tax History
| Year | Tax Paid | Tax Assessment Tax Assessment Total Assessment is a certain percentage of the fair market value that is determined by local assessors to be the total taxable value of land and additions on the property. | Land | Improvement |
|---|---|---|---|---|
| 2025 | $2,252 | $165,731 | $35,513 | $130,218 |
| 2024 | $2,252 | $162,482 | $34,817 | $127,665 |
| 2023 | $2,224 | $159,296 | $34,134 | $125,162 |
| 2022 | $2,180 | $156,173 | $33,465 | $122,708 |
| 2021 | $2,154 | $153,111 | $32,809 | $120,302 |
| 2020 | $2,149 | $151,541 | $32,473 | $119,068 |
| 2019 | $2,100 | $148,569 | $31,836 | $116,733 |
| 2018 | $1,876 | $145,656 | $31,212 | $114,444 |
| 2017 | $1,843 | $142,800 | $30,600 | $112,200 |
| 2016 | $2,042 | $162,441 | $30,458 | $131,983 |
| 2015 | $2,905 | $207,700 | $41,100 | $166,600 |
| 2014 | $2,789 | $197,800 | $39,100 | $158,700 |
Source: Public Records
Map
Nearby Homes
- 61 Evergreen Dr
- 0 Bone Dr
- 342 Ballenger Rd
- 0 Reservoir Rd Unit IG25179983
- 104 LOT Reservoir Rd
- 44 Reservoir Rd
- 443 Hartman Cir
- 21650 Ballenger Rd
- 0 Peak Cir Unit RW24236306
- 0 Peak Cir Unit HD24086567
- 20 Burnt Mill Canyon Rd
- 21645 Jobs Peak Rd
- 0 El Valle Rd Unit CV19051074
- 0 El Valle Rd Unit CV19051065
- 0 El Valle Rd Unit IG25221994
- 47 El Valle Rd
- 0 N Burnt Mill Canyon Rd Unit SR25190570
- 0 N Burnt Mill Canyon Rd Unit GD25182324
- 0 N Burnt Mill Canyon Rd Unit HD25031791
- 21669 Vista Rd
- 615 Mozumdar Dr
- 627 Mozumdar Dr
- 627 Mozumdar Dr
- 614 Mozumdar Dr
- 630 Mozumdar Dr
- 630 Mozumdar Dr
- 631 Mozumdar Dr
- 607 Mozumdar Dr
- 651 Mozumdar Dr
- 21820 Bone Dr
- 601 Mozumdar Dr
- 605 Mozumdar Dr
- 659 Mozumdar Dr
- 659 Mozumdar Dr
- 698 Evergreen Dr
- 571 Mozumdar Dr
- 0 Evergreen Dr Unit EV14193225
- 0 Evergreen Dr Unit RW2141723
- 0 Evergreen Dr Unit EV21186598
- 0 Evergreen Dr Unit 32106968