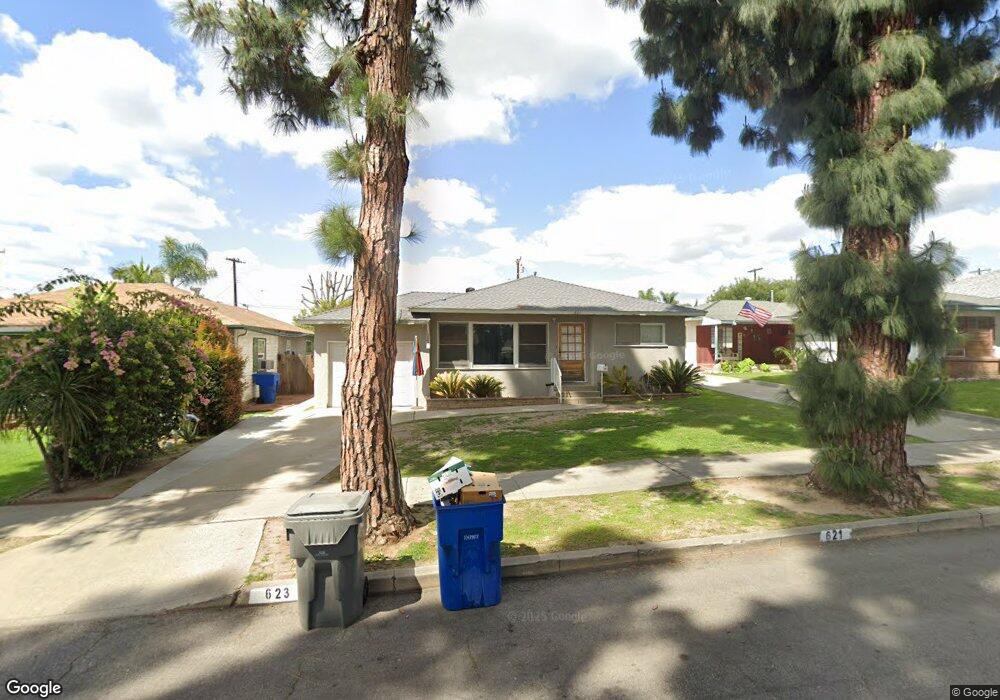
621 N Hazel St La Habra, CA 90631
Estimated Value: $755,936 - $951,000
3
Beds
2
Baths
752
Sq Ft
$1,093/Sq Ft
Est. Value
About This Home
This home is located at 621 N Hazel St, La Habra, CA 90631 and is currently estimated at $822,234, approximately $1,093 per square foot. 621 N Hazel St is a home located in Orange County with nearby schools including Walnut Elementary School, Washington Middle School, and La Habra High School.
Ownership History
Date
Name
Owned For
Owner Type
Purchase Details
Closed on
Oct 17, 2006
Sold by
Todak Thomas S
Bought by
Todak Thomas S and Todak Kelly L
Current Estimated Value
Purchase Details
Closed on
Mar 7, 2003
Sold by
Lambert Tanya
Bought by
Todak Thomas S
Home Financials for this Owner
Home Financials are based on the most recent Mortgage that was taken out on this home.
Original Mortgage
$260,000
Outstanding Balance
$110,549
Interest Rate
5.73%
Mortgage Type
Purchase Money Mortgage
Estimated Equity
$711,685
Purchase Details
Closed on
Jun 10, 2002
Sold by
Lambert Annie L
Bought by
Lambert Edward
Purchase Details
Closed on
Nov 5, 1998
Sold by
Broadbent Charmaine L and Broadbent Duane W
Bought by
Lambert Edward and Lambert Annie L
Home Financials for this Owner
Home Financials are based on the most recent Mortgage that was taken out on this home.
Original Mortgage
$153,750
Interest Rate
6.73%
Mortgage Type
Purchase Money Mortgage
Create a Home Valuation Report for This Property
The Home Valuation Report is an in-depth analysis detailing your home's value as well as a comparison with similar homes in the area
Home Values in the Area
Average Home Value in this Area
Purchase History
| Date | Buyer | Sale Price | Title Company |
|---|---|---|---|
| Todak Thomas S | -- | None Available | |
| Todak Thomas S | $330,000 | Commonwealth Land Title Co | |
| Lambert Edward | -- | -- | |
| Lambert Edward | $205,000 | North American Title Co |
Source: Public Records
Mortgage History
| Date | Status | Borrower | Loan Amount |
|---|---|---|---|
| Open | Todak Thomas S | $260,000 | |
| Previous Owner | Lambert Edward | $153,750 | |
| Closed | Lambert Edward | $30,750 |
Source: Public Records
Tax History Compared to Growth
Tax History
| Year | Tax Paid | Tax Assessment Tax Assessment Total Assessment is a certain percentage of the fair market value that is determined by local assessors to be the total taxable value of land and additions on the property. | Land | Improvement |
|---|---|---|---|---|
| 2025 | $5,631 | $477,942 | $357,380 | $120,562 |
| 2024 | $5,631 | $468,571 | $350,372 | $118,199 |
| 2023 | $5,500 | $459,384 | $343,502 | $115,882 |
| 2022 | $5,441 | $450,377 | $336,767 | $113,610 |
| 2021 | $5,353 | $441,547 | $330,164 | $111,383 |
| 2020 | $5,302 | $437,020 | $326,779 | $110,241 |
| 2019 | $5,160 | $428,451 | $320,371 | $108,080 |
| 2018 | $5,074 | $420,050 | $314,089 | $105,961 |
| 2017 | $4,984 | $411,814 | $307,930 | $103,884 |
| 2016 | $4,868 | $403,740 | $301,892 | $101,848 |
| 2015 | $4,731 | $397,676 | $297,357 | $100,319 |
| 2014 | $4,592 | $389,887 | $291,533 | $98,354 |
Source: Public Records
Map
Nearby Homes
- 950 N Walnut St
- 581 W Greenwood Ave Unit 6
- 162 Reed Ln Unit 48
- 501 Willow St
- 760 N Orange St
- 762 N Orange St
- 764 N Orange St
- 766 N Orange St
- 770 N Orange St
- The Sage Plan at The Birchwoods
- The Poppy Plan at The Birchwoods
- 320 -330 Monte Vista
- 1100 N Euclid St
- 313 W 1st Ave Unit M
- 421 N Marian St
- 220 Olinda Ave
- 720 W La Habra Blvd
- 161 W Hidden Ln
- 1320 Marlei Rd
- 1421 Launer Dr
- 625 N Hazel St
- 619 N Hazel St
- 623 N Hazel St
- 629 N Hazel St
- 615 N Hazel St
- 633 N Hazel St
- 620 N Walnut St
- 616 N Walnut St
- 624 N Walnut St
- 612 N Walnut St
- 628 N Walnut St
- 620 N Hazel St
- 624 N Hazel St
- 616 N Hazel St
- 409 W Greenwood Ave
- 628 N Hazel St
- 612 N Hazel St
- 634 N Walnut St
- 403 W Greenwood Ave
- 411 W Greenwood Ave