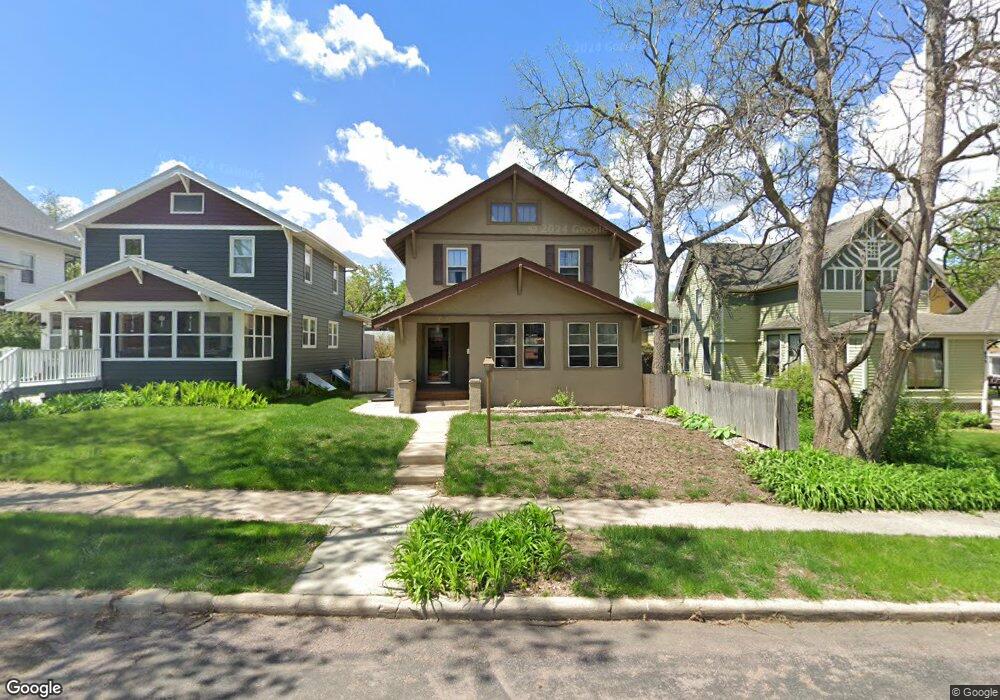
621 N Summit Ave Sioux Falls, SD 57104
Terrace Park NeighborhoodEstimated Value: $274,000 - $315,000
3
Beds
2
Baths
2,075
Sq Ft
$140/Sq Ft
Est. Value
About This Home
This home is located at 621 N Summit Ave, Sioux Falls, SD 57104 and is currently estimated at $289,614, approximately $139 per square foot. 621 N Summit Ave is a home located in Minnehaha County with nearby schools including Hawthorne Elementary School, Patrick Henry Middle School, and Lincoln High School.
Ownership History
Date
Name
Owned For
Owner Type
Purchase Details
Closed on
Jul 22, 2022
Sold by
Webb Schuyler and Webb Tiffany
Bought by
Robertson Darin and Hansen Julee Louise
Current Estimated Value
Home Financials for this Owner
Home Financials are based on the most recent Mortgage that was taken out on this home.
Original Mortgage
$280,000
Outstanding Balance
$267,974
Interest Rate
5.81%
Estimated Equity
$21,640
Purchase Details
Closed on
Mar 29, 2018
Sold by
Saarinen Max P and Saarinen Jessica J
Bought by
Webb Schuyler and Webb Tiffany
Purchase Details
Closed on
Mar 6, 2015
Sold by
Kimberly K Kimberly K
Bought by
Saarinen Max P and Saarinen Jessica J
Home Financials for this Owner
Home Financials are based on the most recent Mortgage that was taken out on this home.
Original Mortgage
$132,478
Interest Rate
3.75%
Mortgage Type
FHA
Create a Home Valuation Report for This Property
The Home Valuation Report is an in-depth analysis detailing your home's value as well as a comparison with similar homes in the area
Home Values in the Area
Average Home Value in this Area
Purchase History
| Date | Buyer | Sale Price | Title Company |
|---|---|---|---|
| Robertson Darin | $280,000 | Stewart Title Co | |
| Robertson Darin | $280,000 | Stewart Title Co | |
| Webb Schuyler | $159,000 | -- | |
| Saarinen Max P | $135,000 | -- |
Source: Public Records
Mortgage History
| Date | Status | Borrower | Loan Amount |
|---|---|---|---|
| Open | Robertson Darin | $280,000 | |
| Closed | Robertson Darin | $280,000 | |
| Previous Owner | Saarinen Max P | $132,478 |
Source: Public Records
Tax History
| Year | Tax Paid | Tax Assessment Tax Assessment Total Assessment is a certain percentage of the fair market value that is determined by local assessors to be the total taxable value of land and additions on the property. | Land | Improvement |
|---|---|---|---|---|
| 2024 | $2,948 | $218,300 | $21,100 | $197,200 |
| 2023 | $3,055 | $218,300 | $21,100 | $197,200 |
| 2022 | $2,599 | $174,400 | $16,800 | $157,600 |
| 2021 | $2,078 | $141,200 | $0 | $0 |
| 2020 | $2,078 | $133,100 | $0 | $0 |
| 2019 | $1,956 | $122,842 | $0 | $0 |
| 2018 | $1,796 | $118,823 | $0 | $0 |
| 2017 | $1,758 | $113,202 | $12,000 | $101,202 |
| 2016 | $1,758 | $110,919 | $11,000 | $99,919 |
| 2015 | $1,752 | $106,280 | $11,000 | $95,280 |
| 2014 | $1,733 | $106,280 | $11,000 | $95,280 |
Source: Public Records
Map
Nearby Homes
- 608 N Walts Ave
- 611 N Walts Ave
- 517 N Walts Ave
- 623 N Minnesota Ave
- 909 N Walts Ave
- 1013 W 5th St
- 806 N Dakota Ave
- 919 N Dakota Ave
- 418 N Euclid Ave
- 227 N Spring Ave
- 902 W 8th St Unit 3
- 421 N Phillips Ave Unit 301
- 1201 N Dakota Ave
- 1118 W 8th St
- 151 E 4th Place Unit 605
- 151 E 4th Place Unit 606
- 151 E 4th Place Unit 105
- 151 E 4th Place Unit 604
- 151 E 4th Place Unit 101
- 151 E 4th Place Unit 104
- 619 N Summit Ave
- 635 N Summit Ave
- 617 N Summit Ave
- 715 W 3rd St
- 615 N Summit Ave
- 630 N Summit Ave
- 632 N Summit Ave
- 634 N Summit Ave
- 701 N Summit Ave
- 628 N Prairie Ave
- 630 N Prairie Ave
- 626 N Prairie Ave
- 611 N Summit Ave
- 712 W 3rd St
- 622 N Prairie Ave
- 703 N Summit Ave
- 714 W 3rd St
- 607 N Summit Ave
- 620 N Prairie Ave
- 700 N Summit Ave