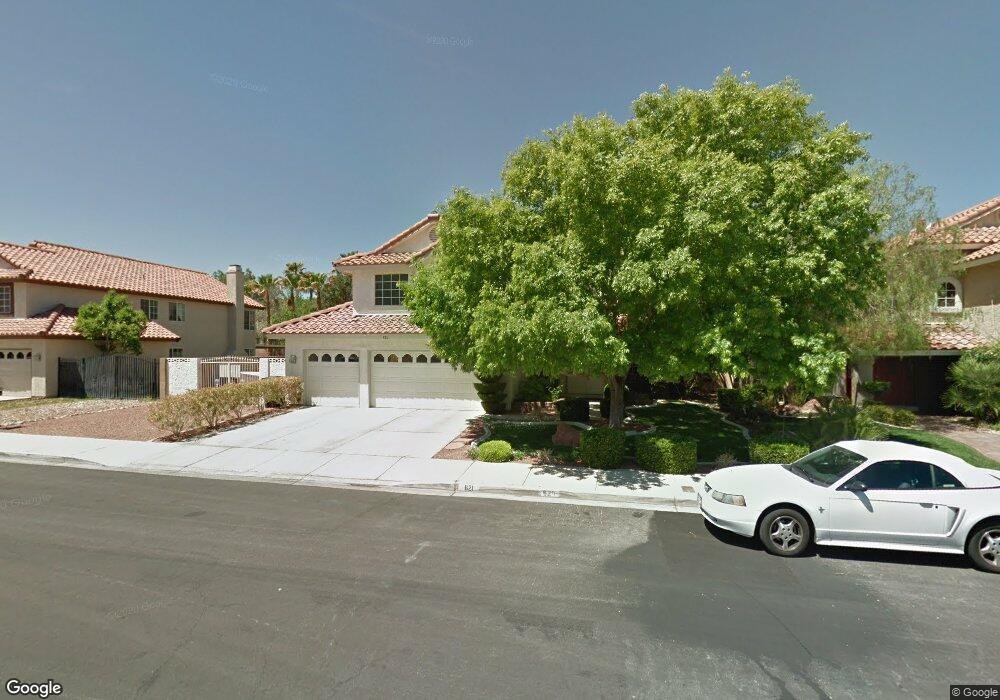
621 Overview Dr Las Vegas, NV 89145
Angel Park NeighborhoodEstimated Value: $674,000 - $740,000
5
Beds
3
Baths
2,808
Sq Ft
$252/Sq Ft
Est. Value
About This Home
This home is located at 621 Overview Dr, Las Vegas, NV 89145 and is currently estimated at $706,306, approximately $251 per square foot. 621 Overview Dr is a home located in Clark County with nearby schools including Walter Jacobson Elementary School, Walter Johnson Junior High School Academy of International Studies, and Palo Verde High School.
Ownership History
Date
Name
Owned For
Owner Type
Purchase Details
Closed on
Aug 4, 2020
Sold by
Ballard Bonnie L and Bonnie L Ballard Living Trust
Bought by
Brooks Kevin Marcus and Brooks Alexandria Lee
Current Estimated Value
Purchase Details
Closed on
Feb 25, 2014
Sold by
621 Overview Llc
Bought by
Ballard Bonnie L and Bonnie L Ballard Living Trust
Purchase Details
Closed on
Oct 29, 2012
Sold by
621 Overview Llc
Bought by
Bonnie L Balland Living Trust
Purchase Details
Closed on
Aug 24, 2007
Sold by
Ballard Bonnie L
Bought by
Ballard Bonnie L and Bonnie L Ballard Living Trust
Purchase Details
Closed on
Aug 20, 2001
Sold by
Noyes Frank C and Noyes Alanna Jean
Bought by
Ballard Bonnie L
Home Financials for this Owner
Home Financials are based on the most recent Mortgage that was taken out on this home.
Original Mortgage
$197,000
Interest Rate
7%
Purchase Details
Closed on
Mar 21, 1994
Sold by
Bailey and Bailey Mcgah
Bought by
Noyes Frank C and Noyes Alanna Jean
Create a Home Valuation Report for This Property
The Home Valuation Report is an in-depth analysis detailing your home's value as well as a comparison with similar homes in the area
Home Values in the Area
Average Home Value in this Area
Purchase History
| Date | Buyer | Sale Price | Title Company |
|---|---|---|---|
| Brooks Kevin Marcus | $475,000 | Stewart Title Company Fo | |
| Ballard Bonnie L | -- | None Available | |
| Bonnie L Balland Living Trust | $201,586 | None Available | |
| Ballard Bonnie L | -- | Southwest Title | |
| 621 Overview Llc | -- | Southwest Title | |
| Ballard Bonnie L | $246,250 | Old Republic Title Company | |
| Noyes Frank C | $187,500 | United Title |
Source: Public Records
Mortgage History
| Date | Status | Borrower | Loan Amount |
|---|---|---|---|
| Previous Owner | Ballard Bonnie L | $197,000 |
Source: Public Records
Tax History Compared to Growth
Tax History
| Year | Tax Paid | Tax Assessment Tax Assessment Total Assessment is a certain percentage of the fair market value that is determined by local assessors to be the total taxable value of land and additions on the property. | Land | Improvement |
|---|---|---|---|---|
| 2025 | $4,245 | $146,133 | $47,250 | $98,883 |
| 2024 | $3,931 | $146,133 | $47,250 | $98,883 |
| 2023 | $3,931 | $141,564 | $47,600 | $93,964 |
| 2022 | $3,640 | $126,597 | $39,900 | $86,697 |
| 2021 | $3,308 | $115,459 | $35,000 | $80,459 |
| 2020 | $3,069 | $113,365 | $33,250 | $80,115 |
| 2019 | $2,876 | $109,454 | $30,100 | $79,354 |
| 2018 | $2,744 | $101,272 | $24,850 | $76,422 |
| 2017 | $3,369 | $102,758 | $24,850 | $77,908 |
| 2016 | $2,569 | $97,570 | $19,600 | $77,970 |
| 2015 | $2,564 | $91,040 | $18,200 | $72,840 |
| 2014 | $2,484 | $82,692 | $12,250 | $70,442 |
Source: Public Records
Map
Nearby Homes
- 8612 Blissville Ave
- 8425 Running Deer Ave Unit 104
- 8452 Boseck Dr Unit 208
- 8452 Boseck Dr Unit 159
- 8452 Boseck Dr Unit 287
- 8417 Running Deer Ave Unit 101
- 8400 White Eagle Ave Unit 203
- 525 Indian Princess Dr Unit 101
- 525 Indian Princess Dr Unit 204
- 8640 Blissville Ave
- 8409 Running Deer Ave Unit 104
- 8628 Highacre Dr
- 508 Indian Princess Dr Unit 102
- 8450 Alta Dr Unit 121
- 805 Overview Dr
- 8537 Highland View Ave
- 8541 Highland View Ave
- 609 Ampere Ln
- 817 Hillgrove Ct
- 8325 Alta Dr
- 617 Overview Dr
- 625 Overview Dr
- 620 Heartline Dr
- 616 Heartline Dr
- 613 Overview Dr
- 629 Overview Dr
- 616 Overview Dr
- 620 Overview Dr
- 612 Heartline Dr
- 612 Overview Dr
- 624 Heartline Dr
- 624 Overview Dr
- 609 Overview Dr
- 8604 Grandbank Dr
- 608 Heartline Dr
- 633 Overview Dr
- 608 Overview Dr
- 8608 Grandbank Dr
- 604 Heartline Dr
- 621 Heartline Dr