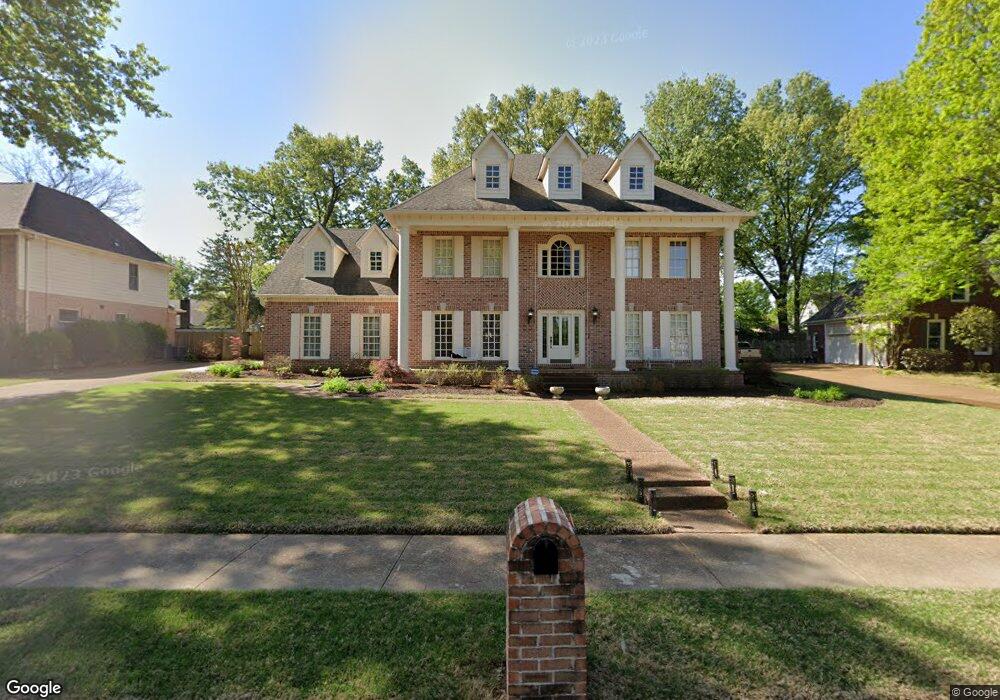
621 Quail Crest Dr Collierville, TN 38017
Estimated Value: $459,000 - $559,000
4
Beds
4
Baths
4,048
Sq Ft
$130/Sq Ft
Est. Value
About This Home
This home is located at 621 Quail Crest Dr, Collierville, TN 38017 and is currently estimated at $524,436, approximately $129 per square foot. 621 Quail Crest Dr is a home located in Shelby County with nearby schools including Collierville Elementary School, West Collierville Middle School, and Collierville High School.
Ownership History
Date
Name
Owned For
Owner Type
Purchase Details
Closed on
Apr 25, 2006
Sold by
Cates Donald R and Obrecht Jennifer A
Bought by
Fulton R Michael and Fulton Lynda R
Current Estimated Value
Home Financials for this Owner
Home Financials are based on the most recent Mortgage that was taken out on this home.
Original Mortgage
$150,000
Outstanding Balance
$85,801
Interest Rate
6.28%
Mortgage Type
Fannie Mae Freddie Mac
Estimated Equity
$438,635
Purchase Details
Closed on
Jul 16, 2003
Sold by
Mullins Orville D and Mullins Paula K
Bought by
Cates Donald R and Obrecht Jennifer A
Home Financials for this Owner
Home Financials are based on the most recent Mortgage that was taken out on this home.
Original Mortgage
$209,000
Interest Rate
3.12%
Mortgage Type
Unknown
Purchase Details
Closed on
May 22, 2002
Sold by
Beebe Michael Stephen
Bought by
Beebe Linda Louise
Create a Home Valuation Report for This Property
The Home Valuation Report is an in-depth analysis detailing your home's value as well as a comparison with similar homes in the area
Home Values in the Area
Average Home Value in this Area
Purchase History
| Date | Buyer | Sale Price | Title Company |
|---|---|---|---|
| Fulton R Michael | $333,000 | None Available | |
| Cates Donald R | $317,000 | Realty Title | |
| Beebe Linda Louise | -- | -- |
Source: Public Records
Mortgage History
| Date | Status | Borrower | Loan Amount |
|---|---|---|---|
| Open | Fulton R Michael | $150,000 | |
| Previous Owner | Cates Donald R | $209,000 |
Source: Public Records
Tax History Compared to Growth
Tax History
| Year | Tax Paid | Tax Assessment Tax Assessment Total Assessment is a certain percentage of the fair market value that is determined by local assessors to be the total taxable value of land and additions on the property. | Land | Improvement |
|---|---|---|---|---|
| 2025 | $3,287 | $128,200 | $26,850 | $101,350 |
| 2024 | $3,287 | $96,975 | $17,725 | $79,250 |
| 2023 | $5,072 | $96,975 | $17,725 | $79,250 |
| 2022 | $4,955 | $96,975 | $17,725 | $79,250 |
| 2021 | $5,014 | $96,975 | $17,725 | $79,250 |
| 2020 | $4,936 | $83,950 | $17,725 | $66,225 |
| 2019 | $3,400 | $83,950 | $17,725 | $66,225 |
| 2018 | $3,400 | $83,950 | $17,725 | $66,225 |
| 2017 | $3,450 | $83,950 | $17,725 | $66,225 |
| 2016 | $3,312 | $75,800 | $0 | $0 |
| 2014 | $3,312 | $75,800 | $0 | $0 |
Source: Public Records
Map
Nearby Homes
- 250 S Monterey Mills Cove
- 135 Piperton Preserve Park
- 40 Rambling Rex Dr
- 759 W Powell Rd
- 858 Gunnison Dr
- 595 Kenrose St
- 475 Ginny Ln
- 566 Green Oaks Ln
- 883 Mercersburg Cove
- 607 Forestdale Dr
- 586 Warwick Willow Cove
- 580 Warwick Willow Ln
- 890 W Tree Dr
- 621 Warwick Oaks Ln W
- 536 Warwick Willow Ln
- 542 Country Springs Dr
- 1023 Greencliff Rd
- 549 Peterson Lake Rd
- 230 W Powell Rd
- 946 Broken Arrow Cove
- 631 Quail Crest Dr
- 629 Fox Chase Cove N
- 636 Fox Chase Cove N
- 624 Quail Crest Dr
- 601 Quail Crest Dr
- 628 Fox Lair Cove
- 636 Fox Lair Cove
- 667 Port Natchez Dr
- 610 Quail Crest Dr
- 677 Port Natchez Dr
- 630 Fox Chase Cove N
- 623 Fox Chase Cove N
- 591 Quail Crest Dr
- 624 Fox Lair Cove
- 687 Windy Knoll Cove
- 635 Fox Lair Cove
- 662 Amber Hill Cove
- 621 Antebellum Way
- 674 Amber Hill Cove
- 639 Antebellum Way