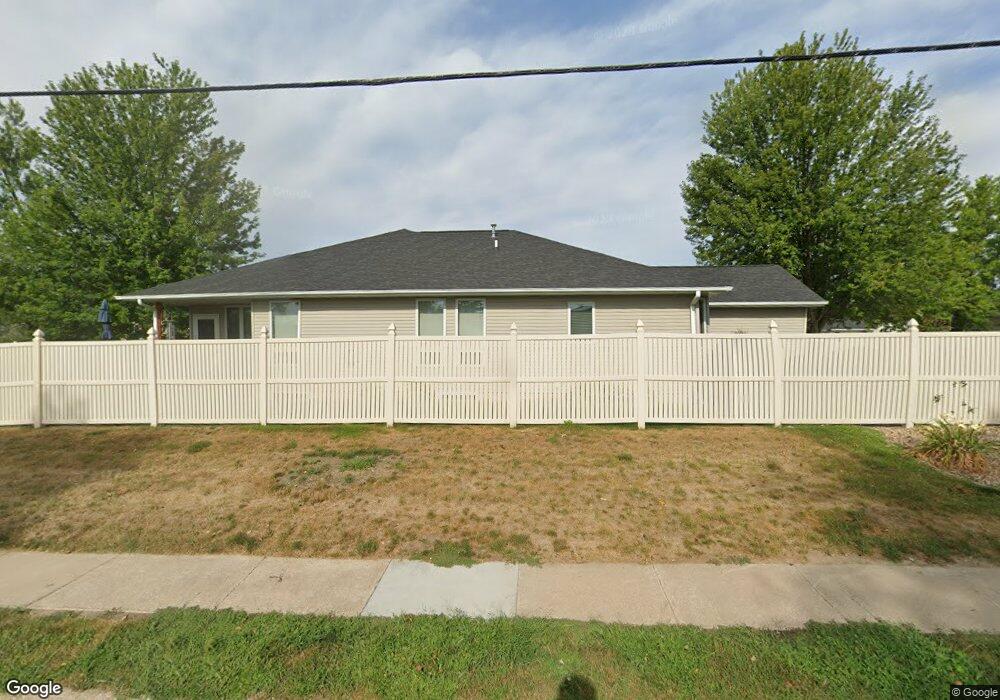
621 Tiffany Dr NE Unit 621 Cedar Rapids, IA 52402
Kenwood Park NeighborhoodEstimated Value: $270,000 - $389,000
3
Beds
4
Baths
2,818
Sq Ft
$108/Sq Ft
Est. Value
About This Home
This home is located at 621 Tiffany Dr NE Unit 621, Cedar Rapids, IA 52402 and is currently estimated at $304,342, approximately $107 per square foot. 621 Tiffany Dr NE Unit 621 is a home located in Linn County with nearby schools including Arthur Elementary School, Franklin Middle School, and George Washington High School.
Ownership History
Date
Name
Owned For
Owner Type
Purchase Details
Closed on
Jun 23, 2020
Sold by
Hinz Sylvester J and Hinz Joanne L
Bought by
Hinz Dennis James and Hinz Kevin Paul
Current Estimated Value
Purchase Details
Closed on
Jul 28, 2009
Sold by
Schuller Mary Ruth and Schuller Mary R
Bought by
Hinz Sylvester J and Hinz Joanne L
Purchase Details
Closed on
Dec 31, 1999
Sold by
Wilmar Trust
Bought by
Schuller Mary Ruth
Home Financials for this Owner
Home Financials are based on the most recent Mortgage that was taken out on this home.
Original Mortgage
$70,000
Interest Rate
7.81%
Create a Home Valuation Report for This Property
The Home Valuation Report is an in-depth analysis detailing your home's value as well as a comparison with similar homes in the area
Home Values in the Area
Average Home Value in this Area
Purchase History
| Date | Buyer | Sale Price | Title Company |
|---|---|---|---|
| Hinz Dennis James | -- | None Available | |
| Hinz Sylvester J | $224,000 | None Available | |
| Schuller Mary Ruth | $224,500 | -- |
Source: Public Records
Mortgage History
| Date | Status | Borrower | Loan Amount |
|---|---|---|---|
| Previous Owner | Schuller Mary Ruth | $70,000 |
Source: Public Records
Tax History Compared to Growth
Tax History
| Year | Tax Paid | Tax Assessment Tax Assessment Total Assessment is a certain percentage of the fair market value that is determined by local assessors to be the total taxable value of land and additions on the property. | Land | Improvement |
|---|---|---|---|---|
| 2025 | $3,726 | $245,300 | $34,500 | $210,800 |
| 2024 | $4,408 | $239,900 | $28,000 | $211,900 |
| 2023 | $4,408 | $228,000 | $28,000 | $200,000 |
| 2022 | $4,328 | $217,900 | $28,000 | $189,900 |
| 2021 | $4,720 | $217,900 | $28,000 | $189,900 |
| 2020 | $4,720 | $222,500 | $28,000 | $194,500 |
| 2019 | $4,058 | $196,800 | $28,000 | $168,800 |
| 2018 | $3,984 | $196,800 | $28,000 | $168,800 |
| 2017 | $4,480 | $205,700 | $17,000 | $188,700 |
| 2016 | $4,198 | $197,500 | $17,000 | $180,500 |
| 2015 | $4,305 | $202,310 | $17,000 | $185,310 |
| 2014 | $4,120 | $202,310 | $17,000 | $185,310 |
| 2013 | $4,028 | $202,310 | $17,000 | $185,310 |
Source: Public Records
Map
Nearby Homes
- 625 Tiffany Dr NE
- 633 Tiffany Dr NE
- 629 Tiffany Dr NE
- 3007 Yorkshire Dr NE
- 3003 Yorkshire Dr NE
- 616 Staub Ct NE
- 624 Staub Ct NE
- 3012 E Ave NE
- 3008 E Ave NE
- 3018 E Ave NE
- 3004 E Ave NE
- 643 Tiffany Dr NE Unit 643
- 639 Tiffany Dr NE Unit 639
- 630 Staub Ct NE
- 3000 E Ave NE
- 3024 E Ave NE
- 3015 Yorkshire Dr NE
- 3011 Yorkshire Dr NE
- 3010 Yorkshire Dr NE
- 3006 Yorkshire Dr NE