NOT LISTED FOR SALE

621 W Carroll St Macomb, IL 61455

Estimated Value: $47,000 - $57,000

6 Beds
2 Baths
1,056 Sq Ft
$48/Sq Ft Est. Value

Last Sold February 08, 2021

Last sale price $40,000 $38 Per Sq Ft

Est. 28% increase in value since last sale

Current estimated payment $322/month

21 Days on Market

About This Home

As of February 2021

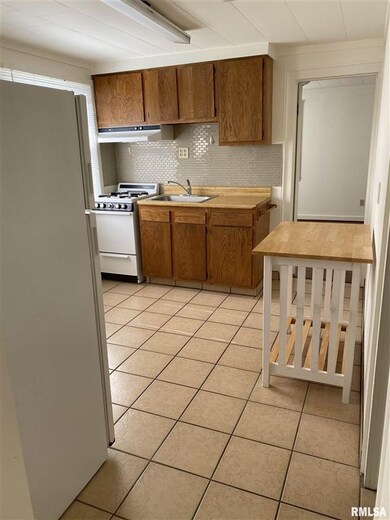
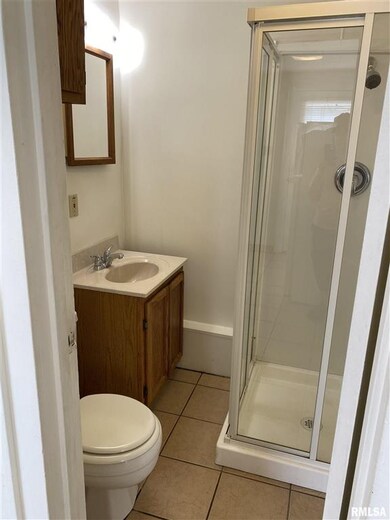
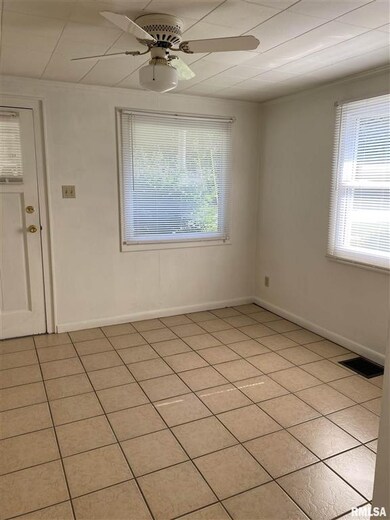
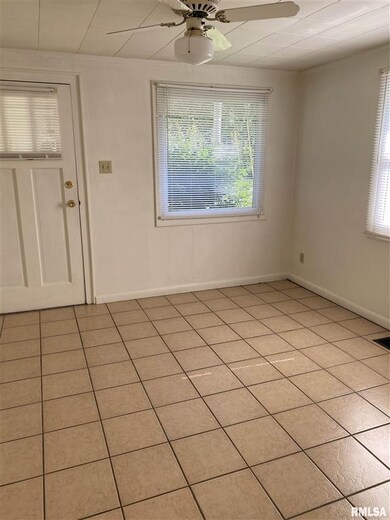
THIS DUPLEX LOCATED CLOSE TO WIU HAS TWO 1 BEDROOM, 1 BATH APARTMENTS, CURRENTLY RENTED @ $450 A MONTH ENDING JULY 31, 2021. TOTAL INCOME $900 A MONTH. NEW SHINGLES IN 2019. TENANTS SPLIT COST OF WATER & GARBAGE. (Sold 2-8-21 - Morrison to Crenshaw)

Last Agent to Sell the Property

Steve Silberer

C21 Purdum-Epperson Inc License #471004172 Listed on: 12/16/2020

Last Buyer's Agent

Kenny Meyer

eXp Realty, LLC License #475191724

eXp Realty, LLC

Property Details

Home Type

  • Multi-Family

Est. Annual Taxes

  • $1,594

Year Built

  • Built in 1930

Lot Details

  • 5,663

Home Design

  • Duplex

Schools

  • Macomb High School

Listing and Financial Details

  • Tenant pays for gas & electric, sewer, water

Property Details

Home Type

Multi-Family

Est. Annual Taxes

$1,594

Year Built

Built in 1930

Lot Details

0

Listing Details

  • Class: Multi-Family
  • Type: Residential Income
  • Style: Duplex/Side by Side
  • Legal Description: W 10' LOT 3 & E 40' LOT 4 BLK 54 - N OF RR WESTERN ADD
  • Lvt Date: 12/16/2020
  • Year Built: 1930
  • Senior Community: No
  • Special Features: None
  • Property Sub Type: MultiFamily

Interior Features

  • Basement: Slab
  • Price Per Sq Ft: 37.88
  • Total Sq Ft: 1056

Exterior Features

  • Exterior: Concrete
  • Road Access: Curbs & Gutters
  • Roofing: Shingles

Garage/Parking

  • Number Parking Spaces: 2

Utilities

  • Heating Cooling: Forced Air, Gas, Central Air
  • Water Sewer: Public Sewer, Public Water
  • Laundry Facilities: No Laundry Equipment

Schools

  • High School: Macomb
  • High School: Macomb

Lot Info

  • Estimated Lot Size: 50X206X56X266
  • Lot Description: Level
  • Subdivision: Western
  • Geo Subdivision: IL

Rental Info

  • Tenant Pays: Gas & Electric, Sewer, Water
  • Gross Annual Rent Income: 10800
  • Lease Information: 1 Year

Tax Info

  • Annual Taxes: 1594.46
  • Parcel Id Number Tax Id: 11-100-647-00
  • Tax Year: 2019

Multi Family

  • Total Number Units: 2
  • Gross Annual Income: 10800
  • Total Number Central Air Units: 2
  • Total Number Electric Meters: 2
  • Total Number Gas Meters: 2
  • Total Number Heating Units: 2
  • Total Number Water Heaters: 2
  • Total Number Water Meters: 1

Ownership History

Date Name Owned For Owner Type

Purchase Details

Listed on
Dec 16, 2020
Closed on
Feb 2, 2021
Sold by
Morrison Barbara J and Morrison Bobbi
Bought by
Crenshaw Blake
Seller's Agent
Steve Silberer
C21 Purdum-Epperson Inc
Buyer's Agent
Kenny Meyer
eXp Realty, LLC
List Price
$42,000
Sold Price
$40,000
Premium/Discount to List
-$2,000
-4.76%
Total Days on Market
21
Current Estimated Value
$51,035

Home Financials for this Owner

Home Financials are based on the most recent Mortgage that was taken out on this home.
Estimated Appreciation
$11,035
Avg. Annual Appreciation
5.77%
Original Mortgage
$93,500
Outstanding Balance
$57,523
Interest Rate
2.65%
Mortgage Type
Future Advance Clause Open End Mortgage
Estimated Equity
-$6,488

Purchase Details

Closed on
Oct 19, 2005
Sold by
Morrison Eldon E
Bought by
Morrison Barbara J and Morrison Bobbi
Source: Public Records

Range of Values:

Collateral Analytics

Collateral Analytics Collateral Analytics AVMs (Automated Valuation Model) employ a number of statistical approaches combined with neighborhood-specific comparable selection guarantees the most up-to-date and precise valuations.

Not Available

Collateral Analytics does not have data for the current month. Please view the chart for historical values.

ICE

ICE Mortgage Technology ICE Mortgage Technology’s AVM (Automated Valuation Model) is a state-of-the-art online residential property valuation tool that provides a quick and accurate estimate of the value of almost any home in the U.S.

Not Available

ICE Mortgage Technology does not have data for the current month. Please view the chart for historical values.

First American

First American First American Data & Analytics’ next-generation AVM combines unrivaled data assets with a blended ensemble of valuation models to produce highly accurate, reliable valuations you can trust.

Not Available

First American does not have data for the current month. Please view the chart for historical values.

Quantarium

Quantarium Quantarium’s valuation service, repeatedly proven the industry’s most accurate and comprehensive, is supercharged with a self-learning and auto-tuning AI engine that continually becomes smarter and more accurate as it processes daily inputs from the industry’s leading RE data lake.

Not Available

Quantarium does not have data for the current month. Please view the chart for historical values.

Average Value
Not Available
List Price
Sold Price
Create a Home Valuation Report for This Property
The Home Valuation Report is an in-depth analysis detailing your home's value as well as a comparison with similar homes in the area

Home Values in the Area

Source: Public Records

Average Home Value in this Area


Source: Public Records

Purchase History

Date Buyer Sale Price Title Company
Crenshaw Blake $110,000 None Available
Morrison Barbara J -- None Available
Source: Public Records

Mortgage History

Date Status Borrower Loan Amount
Open Crenshaw Blake $50,000
Open Crenshaw Blake $93,500
Source: Public Records

Property History

Date Event Price Change Sq Ft Price
02/08/2021 02/08/21 Sold $40,000 -4.8% $38 / Sq Ft
01/06/2021 01/06/21 Pending -- -- --
12/16/2020 12/16/20 For Sale $42,000 -- $40 / Sq Ft
Source: RMLS Alliance

Tax History Compared to Growth

Source: Public Records

Tax History

Year Tax Paid Tax Assessment Tax Assessment Total Assessment is a certain percentage of the fair market value that is determined by local assessors to be the total taxable value of land and additions on the property. Land Improvement
2024 $1,656 $13,794 $704 $13,090
2023 $1,698 $13,794 $704 $13,090
2022 $1,579 $13,365 $682 $12,683
2021 $1,515 $13,365 $682 $12,683
2020 $1,599 $17,494 $3,246 $14,248
2019 $1,594 $17,978 $3,336 $14,642
2018 $1,526 $14,642 $3,336 $11,306
2017 $1,488 $14,642 $3,336 $11,306
2016 $1,429 $14,487 $3,301 $11,186
2015 $1,407 $14,156 $3,226 $10,930
2014 $1,382 $13,944 $3,178 $10,766
2013 $1,349 $13,944 $3,178 $10,766
Source: Public Records

Agents Affiliated with this Home

  • Section Image
  • Section Image
See All Agents

Map

Source: RMLS Alliance

MLS Number: PA1221181

RMLS Alliance

APN: 11-100-647-00