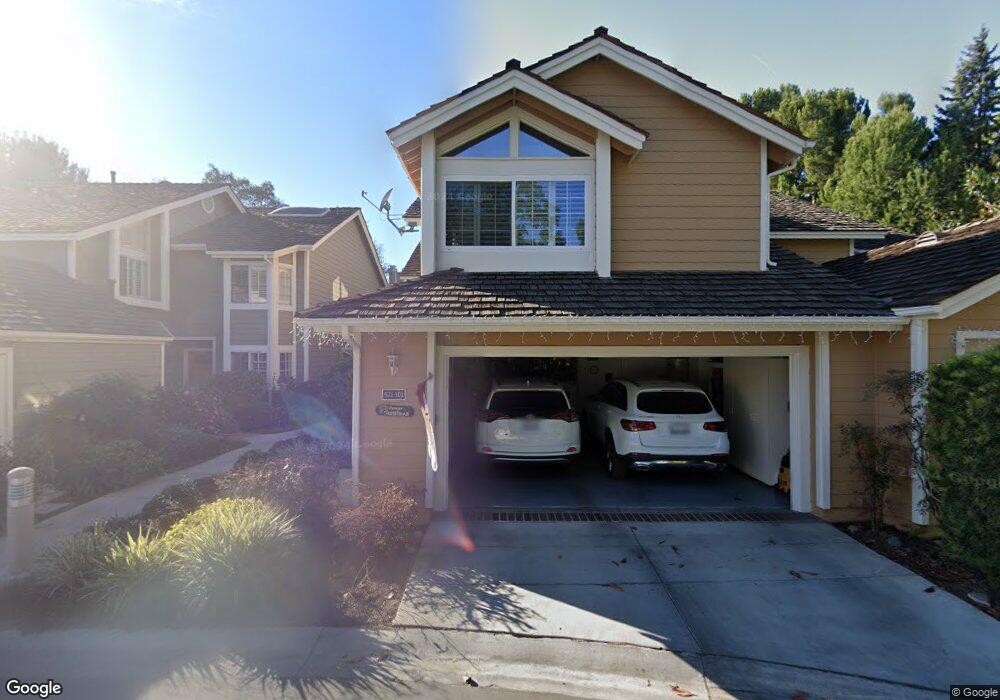
621 Wakefield Ct Unit 101 Long Beach, CA 90803
University Park Estates NeighborhoodEstimated Value: $1,081,000 - $1,214,000
3
Beds
3
Baths
2,120
Sq Ft
$542/Sq Ft
Est. Value
About This Home
This home is located at 621 Wakefield Ct Unit 101, Long Beach, CA 90803 and is currently estimated at $1,149,459, approximately $542 per square foot. 621 Wakefield Ct Unit 101 is a home located in Los Angeles County with nearby schools including Kettering Elementary School, Rogers Middle School, and Woodrow Wilson High School.
Ownership History
Date
Name
Owned For
Owner Type
Purchase Details
Closed on
Jun 8, 2010
Sold by
Emmes Deirdre M
Bought by
Russell John Charles and Russell Vielka
Current Estimated Value
Home Financials for this Owner
Home Financials are based on the most recent Mortgage that was taken out on this home.
Original Mortgage
$329,900
Interest Rate
4.71%
Mortgage Type
New Conventional
Purchase Details
Closed on
Jan 4, 1999
Sold by
Emmes Deirdre M
Bought by
Emmes Deirdre M and Thompson Sheryl D
Home Financials for this Owner
Home Financials are based on the most recent Mortgage that was taken out on this home.
Original Mortgage
$204,000
Interest Rate
6.66%
Purchase Details
Closed on
Oct 5, 1994
Sold by
Kerr James M
Bought by
Emmes Deirdre M and Emmes David M
Home Financials for this Owner
Home Financials are based on the most recent Mortgage that was taken out on this home.
Original Mortgage
$207,200
Interest Rate
4.5%
Create a Home Valuation Report for This Property
The Home Valuation Report is an in-depth analysis detailing your home's value as well as a comparison with similar homes in the area
Home Values in the Area
Average Home Value in this Area
Purchase History
| Date | Buyer | Sale Price | Title Company |
|---|---|---|---|
| Russell John Charles | $624,000 | Fidelity National Title Co | |
| Emmes Deirdre M | -- | Southland Title Corporation | |
| Emmes Deirdre M | $259,000 | Gateway Title |
Source: Public Records
Mortgage History
| Date | Status | Borrower | Loan Amount |
|---|---|---|---|
| Previous Owner | Russell John Charles | $329,900 | |
| Previous Owner | Emmes Deirdre M | $204,000 | |
| Previous Owner | Emmes Deirdre M | $207,200 |
Source: Public Records
Tax History Compared to Growth
Tax History
| Year | Tax Paid | Tax Assessment Tax Assessment Total Assessment is a certain percentage of the fair market value that is determined by local assessors to be the total taxable value of land and additions on the property. | Land | Improvement |
|---|---|---|---|---|
| 2025 | $6,341 | $495,480 | $186,765 | $308,715 |
| 2024 | $6,341 | $485,765 | $183,103 | $302,662 |
| 2023 | $6,236 | $476,241 | $179,513 | $296,728 |
| 2022 | $5,852 | $466,904 | $175,994 | $290,910 |
| 2021 | $5,729 | $457,750 | $172,544 | $285,206 |
| 2019 | $5,644 | $444,175 | $167,427 | $276,748 |
| 2018 | $5,475 | $435,467 | $164,145 | $271,322 |
| 2016 | $5,021 | $418,559 | $157,772 | $260,787 |
| 2015 | $4,820 | $412,273 | $155,403 | $256,870 |
| 2014 | $4,785 | $404,198 | $152,359 | $251,839 |
Source: Public Records
Map
Nearby Homes
- 500 Chelsea Ct Unit 103
- 480 Kakkis Dr Unit 103
- 6211 Parima St
- 6322 Riviera Cir
- 6272 Riviera Cir Unit 3
- 600 John k Dr Unit 102
- 6032 Avenida de Castillo
- 6301 E Bixby Hill Rd
- 6000 Bixby Village Dr Unit 1
- 6028 Bixby Village Dr Unit 97
- 715 N Lariat Cir
- 921 N Hillside Dr
- 436 N Bellflower Blvd Unit 302
- 436 N Bellflower Blvd Unit 312
- 412 N Bellflower Blvd Unit 220
- 564 N Bellflower Blvd Unit 218
- 564 N Bellflower Blvd Unit 316
- 576 N Bellflower Blvd Unit 209
- 564 N Bellflower Blvd Unit 105
- 564 N Bellflower Blvd Unit 203
- 611 Wakefield Ct Unit 102
- 611 Wakefield Ct Unit 101
- 631 Brocton Ct
- 631 Brocton Ct Unit 103
- 631 Brocton Ct Unit 102
- 601 Wakefield Ct Unit 103
- 601 Wakefield Ct Unit 102
- 601 Wakefield Ct Unit 101
- 610 Wakefield Ct Unit 101
- 610 Wakefield Ct Unit 102
- 610 Wakefield Ct Unit 103
- 641 Brocton Ct Unit 102
- 641 Brocton Ct Unit 101
- 600 Wakefield Ct Unit 101
- 600 Wakefield Ct Unit 102
- 600 Wakefield Ct Unit 103
- 651 Brocton Ct Unit 102
- 651 Brocton Ct Unit 101
- 620 Wakefield Ct Unit 101
- 620 Wakefield Ct Unit 102