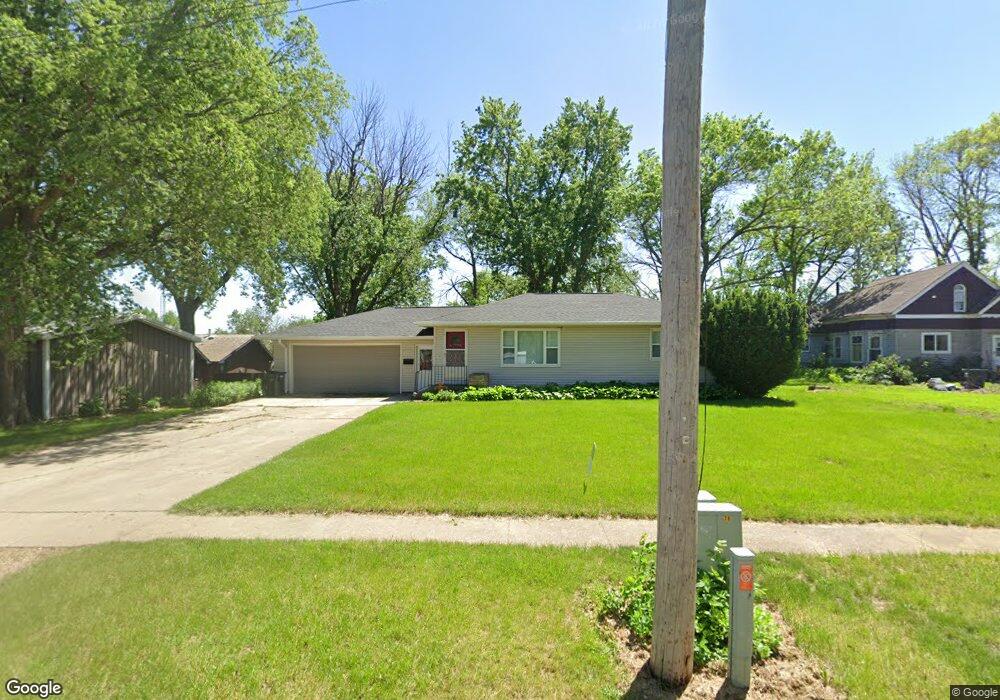
621 Wilkens St Danbury, IA 51019
Estimated Value: $70,000 - $105,000
2
Beds
2
Baths
936
Sq Ft
$91/Sq Ft
Est. Value
About This Home
This home is located at 621 Wilkens St, Danbury, IA 51019 and is currently estimated at $85,583, approximately $91 per square foot. 621 Wilkens St is a home located in Woodbury County with nearby schools including Mapleton Elementary School, Mvao Middle School, and Maple Valley-Anthon Oto High School.
Ownership History
Date
Name
Owned For
Owner Type
Purchase Details
Closed on
Jun 20, 2016
Sold by
Boyle Brock Steven
Bought by
Cornine Ronald G and Ronald G Cornine Revocable Trust
Current Estimated Value
Purchase Details
Closed on
Nov 23, 2015
Sold by
Dean Florence K
Bought by
Boyle Brock Steven
Home Financials for this Owner
Home Financials are based on the most recent Mortgage that was taken out on this home.
Original Mortgage
$25,600
Interest Rate
2.95%
Mortgage Type
New Conventional
Create a Home Valuation Report for This Property
The Home Valuation Report is an in-depth analysis detailing your home's value as well as a comparison with similar homes in the area
Home Values in the Area
Average Home Value in this Area
Purchase History
| Date | Buyer | Sale Price | Title Company |
|---|---|---|---|
| Cornine Ronald G | -- | None Available | |
| Boyle Brock Steven | $32,000 | None Available |
Source: Public Records
Mortgage History
| Date | Status | Borrower | Loan Amount |
|---|---|---|---|
| Previous Owner | Boyle Brock Steven | $25,600 |
Source: Public Records
Tax History Compared to Growth
Tax History
| Year | Tax Paid | Tax Assessment Tax Assessment Total Assessment is a certain percentage of the fair market value that is determined by local assessors to be the total taxable value of land and additions on the property. | Land | Improvement |
|---|---|---|---|---|
| 2025 | $838 | $74,270 | $4,440 | $69,830 |
| 2024 | $838 | $61,430 | $4,440 | $56,990 |
| 2023 | $880 | $61,430 | $4,440 | $56,990 |
| 2022 | $820 | $58,550 | $4,440 | $54,110 |
| 2021 | $820 | $58,550 | $4,440 | $54,110 |
| 2020 | $832 | $54,530 | $4,750 | $49,780 |
| 2019 | $824 | $54,530 | $4,750 | $49,780 |
| 2018 | $810 | $53,530 | $4,750 | $48,780 |
| 2017 | $826 | $53,530 | $4,750 | $48,780 |
| 2016 | $694 | $53,530 | $0 | $0 |
| 2015 | $773 | $50,030 | $4,440 | $45,590 |
| 2014 | $763 | $50,030 | $4,440 | $45,590 |
Source: Public Records
Map
Nearby Homes