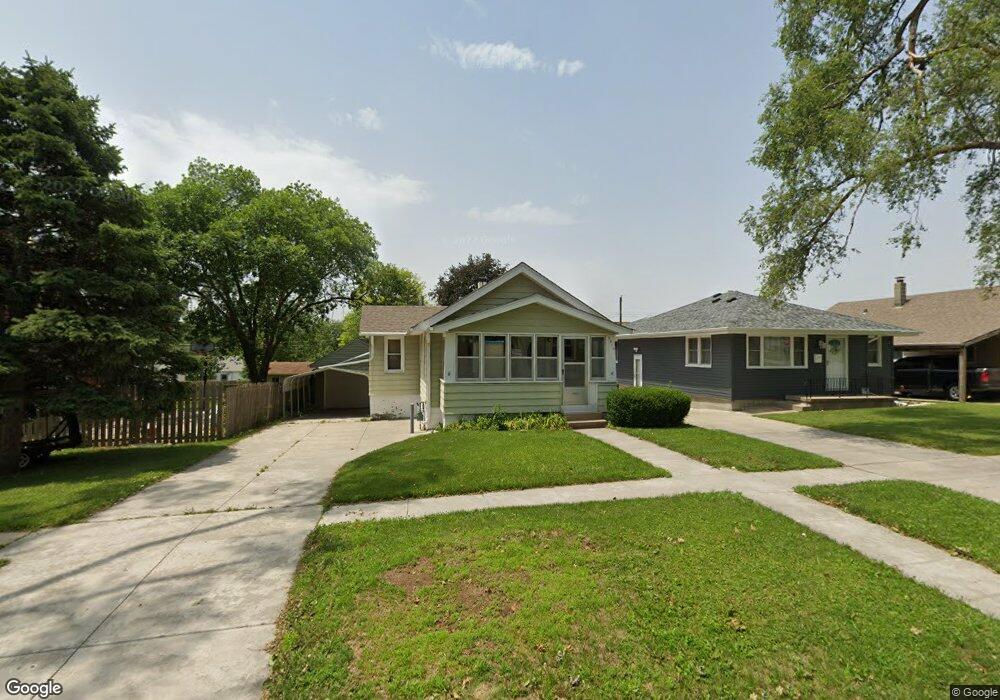
6210 S 39th St Omaha, NE 68107
South Central Omaha NeighborhoodEstimated Value: $160,778 - $180,000
2
Beds
3
Baths
892
Sq Ft
$189/Sq Ft
Est. Value
About This Home
This home is located at 6210 S 39th St, Omaha, NE 68107 and is currently estimated at $168,945, approximately $189 per square foot. 6210 S 39th St is a home located in Douglas County with nearby schools including Gateway Elementary School, Bryan High School, and Sts. Peter and Paul School.
Ownership History
Date
Name
Owned For
Owner Type
Purchase Details
Closed on
Dec 23, 2024
Sold by
Orent Donald E and Orent Dawn
Bought by
Orent Michael S and Orent Crystell L
Current Estimated Value
Home Financials for this Owner
Home Financials are based on the most recent Mortgage that was taken out on this home.
Original Mortgage
$135,327
Outstanding Balance
$134,261
Interest Rate
6.78%
Mortgage Type
FHA
Estimated Equity
$34,684
Purchase Details
Closed on
Jun 14, 2002
Sold by
Burroughs Barton J and Burroughs Karla R Tuite
Bought by
Orent Donald E and Orent Claudia S
Home Financials for this Owner
Home Financials are based on the most recent Mortgage that was taken out on this home.
Original Mortgage
$75,000
Interest Rate
6.78%
Create a Home Valuation Report for This Property
The Home Valuation Report is an in-depth analysis detailing your home's value as well as a comparison with similar homes in the area
Home Values in the Area
Average Home Value in this Area
Purchase History
| Date | Buyer | Sale Price | Title Company |
|---|---|---|---|
| Orent Michael S | $140,000 | None Listed On Document | |
| Orent Donald E | $75,000 | -- |
Source: Public Records
Mortgage History
| Date | Status | Borrower | Loan Amount |
|---|---|---|---|
| Open | Orent Michael S | $135,327 | |
| Previous Owner | Orent Donald E | $75,000 |
Source: Public Records
Tax History Compared to Growth
Tax History
| Year | Tax Paid | Tax Assessment Tax Assessment Total Assessment is a certain percentage of the fair market value that is determined by local assessors to be the total taxable value of land and additions on the property. | Land | Improvement |
|---|---|---|---|---|
| 2024 | $2,901 | $139,400 | $11,200 | $128,200 |
| 2023 | $2,901 | $137,500 | $11,200 | $126,300 |
| 2022 | $2,167 | $101,500 | $10,400 | $91,100 |
| 2021 | $2,148 | $101,500 | $10,400 | $91,100 |
| 2020 | $1,878 | $87,700 | $10,400 | $77,300 |
| 2019 | $1,729 | $80,500 | $10,400 | $70,100 |
| 2018 | $1,731 | $80,500 | $10,400 | $70,100 |
| 2017 | $1,415 | $65,500 | $6,000 | $59,500 |
| 2016 | $1,406 | $65,500 | $6,000 | $59,500 |
| 2015 | $1,387 | $65,500 | $6,000 | $59,500 |
| 2014 | $1,387 | $65,500 | $6,000 | $59,500 |
Source: Public Records
Map
Nearby Homes