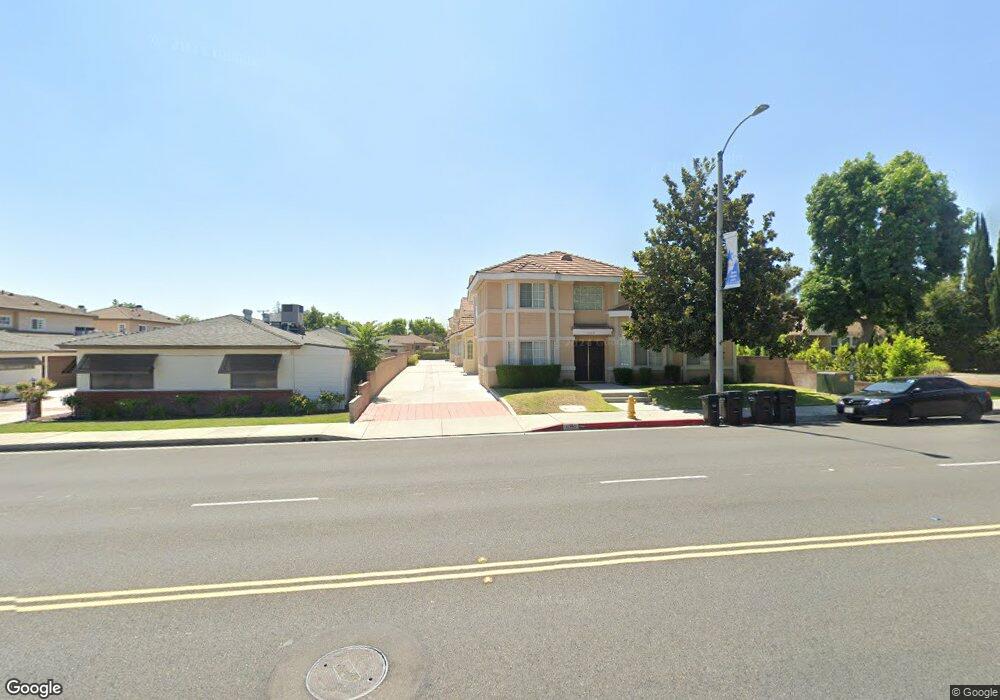
6211 Temple City Blvd Temple City, CA 91780
Estimated Value: $1,053,000 - $1,350,000
4
Beds
3
Baths
2,025
Sq Ft
$567/Sq Ft
Est. Value
About This Home
This home is located at 6211 Temple City Blvd, Temple City, CA 91780 and is currently estimated at $1,148,635, approximately $567 per square foot. 6211 Temple City Blvd is a home located in Los Angeles County with nearby schools including Longden Elementary School, Oak Avenue Intermediate School, and Temple City High School.
Ownership History
Date
Name
Owned For
Owner Type
Purchase Details
Closed on
Feb 20, 2017
Sold by
Chow Nancy Wing Cheung
Bought by
Chow Wing Cheung and The Wing Cheung Chow Revocable Trust
Current Estimated Value
Purchase Details
Closed on
May 2, 2000
Sold by
Wong Mary L
Bought by
Chow Nancy Wing Cheung
Home Financials for this Owner
Home Financials are based on the most recent Mortgage that was taken out on this home.
Original Mortgage
$120,000
Interest Rate
8.62%
Purchase Details
Closed on
Nov 8, 1999
Sold by
Wong Mary L
Bought by
Malay Antonio
Purchase Details
Closed on
Apr 15, 1996
Sold by
Art Tec Development Inc
Bought by
Wong Mary L
Home Financials for this Owner
Home Financials are based on the most recent Mortgage that was taken out on this home.
Original Mortgage
$189,000
Interest Rate
7.8%
Create a Home Valuation Report for This Property
The Home Valuation Report is an in-depth analysis detailing your home's value as well as a comparison with similar homes in the area
Home Values in the Area
Average Home Value in this Area
Purchase History
| Date | Buyer | Sale Price | Title Company |
|---|---|---|---|
| Chow Wing Cheung | -- | None Available | |
| Chow Nancy Wing Cheung | $273,000 | Chicago Title Co | |
| Wong Mary L | -- | -- | |
| Malay Antonio | -- | -- | |
| Wong Mary L | $252,000 | Old Republic Title Company |
Source: Public Records
Mortgage History
| Date | Status | Borrower | Loan Amount |
|---|---|---|---|
| Previous Owner | Chow Nancy Wing Cheung | $120,000 | |
| Previous Owner | Wong Mary L | $189,000 |
Source: Public Records
Tax History Compared to Growth
Tax History
| Year | Tax Paid | Tax Assessment Tax Assessment Total Assessment is a certain percentage of the fair market value that is determined by local assessors to be the total taxable value of land and additions on the property. | Land | Improvement |
|---|---|---|---|---|
| 2025 | $5,185 | $419,574 | $188,884 | $230,690 |
| 2024 | $5,185 | $411,348 | $185,181 | $226,167 |
| 2023 | $5,069 | $403,283 | $181,550 | $221,733 |
| 2022 | $4,755 | $395,377 | $177,991 | $217,386 |
| 2021 | $4,825 | $387,625 | $174,501 | $213,124 |
| 2019 | $4,656 | $376,129 | $169,326 | $206,803 |
| 2018 | $4,498 | $368,755 | $166,006 | $202,749 |
| 2016 | $4,296 | $354,437 | $159,560 | $194,877 |
| 2015 | $4,223 | $349,114 | $157,164 | $191,950 |
| 2014 | $4,164 | $342,276 | $154,086 | $188,190 |
Source: Public Records
Map
Nearby Homes
- 6119 Temple City Blvd
- 9665 Longden Ave
- 6204 Oak Ave
- 9711 Garibaldi Ave
- 6037 Oak Ave
- 5929 Oak Ave
- 9138 Emperor Ave
- 6022 Rowland Ave
- 9861 E Lemon Ave
- 6433 Livia Ave
- 9618 E Camino Real Ave
- 6227 Sultana Ave
- 639 W Longden Ave
- 6159 Rosemead Blvd
- 6137 Rosemead Blvd
- 5819 Baldwin Ave Unit C
- 8939 Emperor Ave
- 662 W Norman Ave
- 0 Sultana Ave
- 5823 Myda Ave
- 6215 Temple City Blvd
- 6213 Temple City Blvd Unit 3
- 6209 Temple City Blvd Unit 1
- 6217 Temple City Blvd
- 6227 Temple City Blvd
- 6248 Primrose Ave
- 6238 Primrose Ave
- 6258 Primrose Ave
- 6232 Primrose Ave
- 6231 Temple City Blvd
- 6153 Temple City Blvd
- 6155 Temple City Blvd Unit 4
- 6157 Temple City Blvd Unit 3
- 6159 Temple City Blvd
- 6161 Temple City Blvd Unit 1
- 6151 Temple City Blvd Unit 6
- 6220 Primrose Ave
- 6266 Primrose Ave
- 6235 Temple City Blvd
- 6147 Temple City Blvd Unit D