Estimated Value: $727,089 - $772,000
4
Beds
2
Baths
1,466
Sq Ft
$512/Sq Ft
Est. Value
About This Home
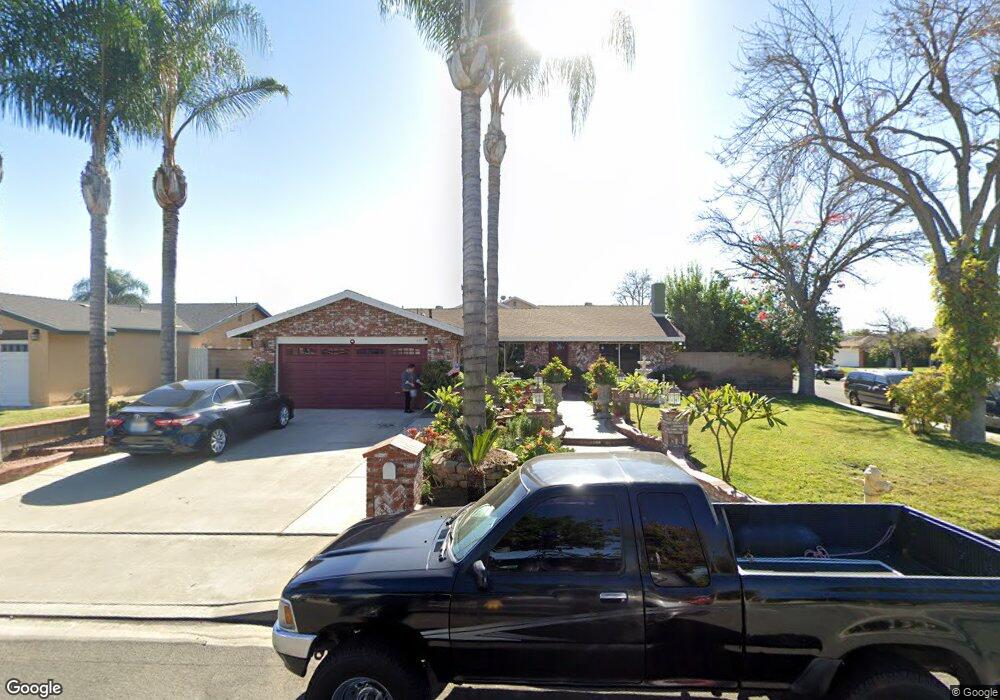
This home is located at 6213 Grant St, Chino, CA 91710 and is currently estimated at $750,022, approximately $511 per square foot. 6213 Grant St is a home located in San Bernardino County with nearby schools including Alicia Cortez Elementary, Magnolia Junior High, and Chino High School.
Ownership History
Date
Name
Owned For
Owner Type
Purchase Details
Closed on
Feb 20, 1997
Sold by
American Svgs Bank Fa
Bought by
Federal National Mortgage Association
Current Estimated Value
Home Financials for this Owner
Home Financials are based on the most recent Mortgage that was taken out on this home.
Original Mortgage
$138,242
Outstanding Balance
$16,053
Interest Rate
7.86%
Mortgage Type
FHA
Estimated Equity
$733,969
Purchase Details
Closed on
Sep 21, 1994
Sold by
Household Finance Corp Of California
Bought by
Mendoza Juan Garcia and Garcia Maria N
Home Financials for this Owner
Home Financials are based on the most recent Mortgage that was taken out on this home.
Original Mortgage
$137,730
Interest Rate
8.54%
Mortgage Type
FHA
Purchase Details
Closed on
Apr 11, 1994
Sold by
Housekey Financial Corp
Bought by
Household Finance Corp Of California
Create a Home Valuation Report for This Property
The Home Valuation Report is an in-depth analysis detailing your home's value as well as a comparison with similar homes in the area
Home Values in the Area
Average Home Value in this Area
Purchase History
| Date | Buyer | Sale Price | Title Company |
|---|---|---|---|
| Federal National Mortgage Association | -- | Orange Coast Title | |
| Mendoza Juan Garcia | $140,000 | Fidelity National Title Ins | |
| Household Finance Corp Of California | $25,153 | World Title Company |
Source: Public Records
Mortgage History
| Date | Status | Borrower | Loan Amount |
|---|---|---|---|
| Open | Federal National Mortgage Association | $138,242 | |
| Previous Owner | Mendoza Juan Garcia | $137,730 |
Source: Public Records
Tax History Compared to Growth
Tax History
| Year | Tax Paid | Tax Assessment Tax Assessment Total Assessment is a certain percentage of the fair market value that is determined by local assessors to be the total taxable value of land and additions on the property. | Land | Improvement |
|---|---|---|---|---|
| 2025 | $2,564 | $234,735 | $58,620 | $176,115 |
| 2024 | $2,564 | $230,133 | $57,471 | $172,662 |
| 2023 | $2,494 | $225,620 | $56,344 | $169,276 |
| 2022 | $2,479 | $221,196 | $55,239 | $165,957 |
| 2021 | $2,431 | $216,859 | $54,156 | $162,703 |
| 2020 | $2,399 | $214,636 | $53,601 | $161,035 |
| 2019 | $2,358 | $210,427 | $52,550 | $157,877 |
| 2018 | $2,306 | $206,301 | $51,520 | $154,781 |
| 2017 | $2,265 | $202,256 | $50,510 | $151,746 |
| 2016 | $2,117 | $198,291 | $49,520 | $148,771 |
| 2015 | $2,075 | $195,312 | $48,776 | $146,536 |
| 2014 | $2,034 | $191,487 | $47,821 | $143,666 |
Source: Public Records
Map
Nearby Homes
- 12765 Ross Ave
- 12524 Ross Ave
- 12689 Cypress Ave
- 6542 Hamilton St
- 12811 Oaks Ave
- 6016 Harrison St
- 6061 Barbara St
- 13014 Bermuda Ave
- 5925 Riverside Dr Unit 12
- 2321 S Magnolia Ave Unit 6E
- 1135 W Whittlers Ln Unit 49
- 12796 17th St
- 13022 Cypress Ave
- 6667 King St
- 13006 Falcon Place
- 12947 Robin Ln
- 6648 Riverside Dr Unit 3
- 6703 Poinsettia Ct
- 1162 W Philadelphia St
- 6703 Aster Ct
- 6225 Grant St
- 6214 Hamilton Ct
- 6226 Hamilton Ct
- 6237 Grant St
- 6212 Grant St
- 6238 Hamilton Ct
- 12632 Carissa Ave
- 6224 Grant St
- 6190 Grant St
- 12644 Carissa Ave
- 6249 Grant St
- 6236 Grant St
- 6240 Hamilton Ct
- 12656 Carissa Ave
- 6188 Grant St
- 6215 Hamilton Ct
- 6227 Hamilton Ct
- 6225 Truman Ct
- 12621 Birch Ave
- 6248 Grant St