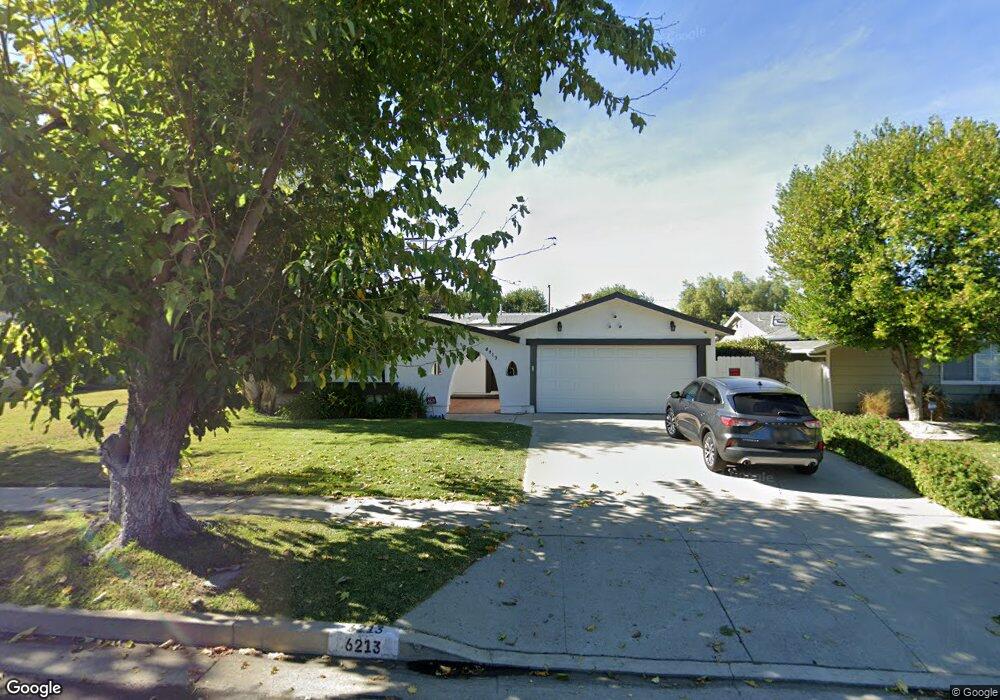
6213 Le Sage Ave Woodland Hills, CA 91367
Estimated Value: $1,094,000 - $1,431,000
4
Beds
2
Baths
1,886
Sq Ft
$629/Sq Ft
Est. Value
About This Home
This home is located at 6213 Le Sage Ave, Woodland Hills, CA 91367 and is currently estimated at $1,186,487, approximately $629 per square foot. 6213 Le Sage Ave is a home located in Los Angeles County with nearby schools including Lockhurst Drive Charter Elementary, Woodlake Elementary Community Charter, and Haynes Charter For Enriched Studies.
Ownership History
Date
Name
Owned For
Owner Type
Purchase Details
Closed on
Sep 21, 2023
Sold by
Cohen Jason Sean and Cohen Julie Dawn
Bought by
Jason & Julie Cohen Living Trust and Cohen
Current Estimated Value
Purchase Details
Closed on
Jan 8, 2003
Sold by
Baruch Daniel A
Bought by
Cohen Jason Sean and Cohen Julie Dawn
Home Financials for this Owner
Home Financials are based on the most recent Mortgage that was taken out on this home.
Original Mortgage
$270,000
Interest Rate
5.83%
Mortgage Type
Balloon
Purchase Details
Closed on
Sep 17, 1997
Sold by
Lavine Ronald S
Bought by
Baruch Daniel A and Baruch Bonnie D
Home Financials for this Owner
Home Financials are based on the most recent Mortgage that was taken out on this home.
Original Mortgage
$206,150
Interest Rate
7.36%
Create a Home Valuation Report for This Property
The Home Valuation Report is an in-depth analysis detailing your home's value as well as a comparison with similar homes in the area
Home Values in the Area
Average Home Value in this Area
Purchase History
| Date | Buyer | Sale Price | Title Company |
|---|---|---|---|
| Jason & Julie Cohen Living Trust | -- | None Listed On Document | |
| Cohen Jason Sean | $400,000 | Multiple | |
| Baruch Daniel A | $217,000 | First American Title Co | |
| Lavine Ronald S | -- | First American Title Co |
Source: Public Records
Mortgage History
| Date | Status | Borrower | Loan Amount |
|---|---|---|---|
| Previous Owner | Cohen Jason Sean | $270,000 | |
| Previous Owner | Baruch Daniel A | $206,150 |
Source: Public Records
Tax History Compared to Growth
Tax History
| Year | Tax Paid | Tax Assessment Tax Assessment Total Assessment is a certain percentage of the fair market value that is determined by local assessors to be the total taxable value of land and additions on the property. | Land | Improvement |
|---|---|---|---|---|
| 2025 | $7,205 | $579,312 | $401,178 | $178,134 |
| 2024 | $7,205 | $567,954 | $393,312 | $174,642 |
| 2023 | $7,070 | $556,818 | $385,600 | $171,218 |
| 2022 | $6,748 | $545,901 | $378,040 | $167,861 |
| 2021 | $6,660 | $535,198 | $370,628 | $164,570 |
| 2019 | $6,466 | $519,326 | $359,636 | $159,690 |
| 2018 | $6,359 | $509,144 | $352,585 | $156,559 |
| 2016 | $6,070 | $489,376 | $338,895 | $150,481 |
| 2015 | $5,983 | $482,026 | $333,805 | $148,221 |
| 2014 | $6,009 | $472,585 | $327,267 | $145,318 |
Source: Public Records
Map
Nearby Homes
- 6172 Dalecrest Ave
- 6236 Kenwater Ave
- 6227 Glide Ave
- 23812 Calvert St
- 23549 Victory Blvd Unit 21
- 23432 Victory Blvd
- 6001 Manton Ave
- 6416 Kenwater Place
- 6153 Debs Ave
- 5929 Adler Ave
- 24017 Sylvan St
- 23416 Califa St
- 23238 Victory Blvd
- 6022 Elba Place
- 23201 Oxnard St
- 23357 Hatteras St
- 24208 Gilmore St
- 6020 Neddy Ave
- 23952 Nomar St
- 24244 Friar St
- 6207 Le Sage Ave
- 6219 Le Sage Ave
- 6201 Le Sage Ave
- 6225 Le Sage Ave
- 23556 Styles St
- 6179 Le Sage Ave
- 6231 Le Sage Ave
- 6212 Platt Ave
- 6218 Platt Ave
- 6206 Platt Ave
- 23550 Styles St
- 6226 Platt Ave
- 6165 Manton Ave
- 6173 Le Sage Ave
- 6237 Le Sage Ave
- 6200 Platt Ave
- 6232 Platt Ave
- 23559 Styles St
- 6159 Manton Ave
- 23544 Styles St