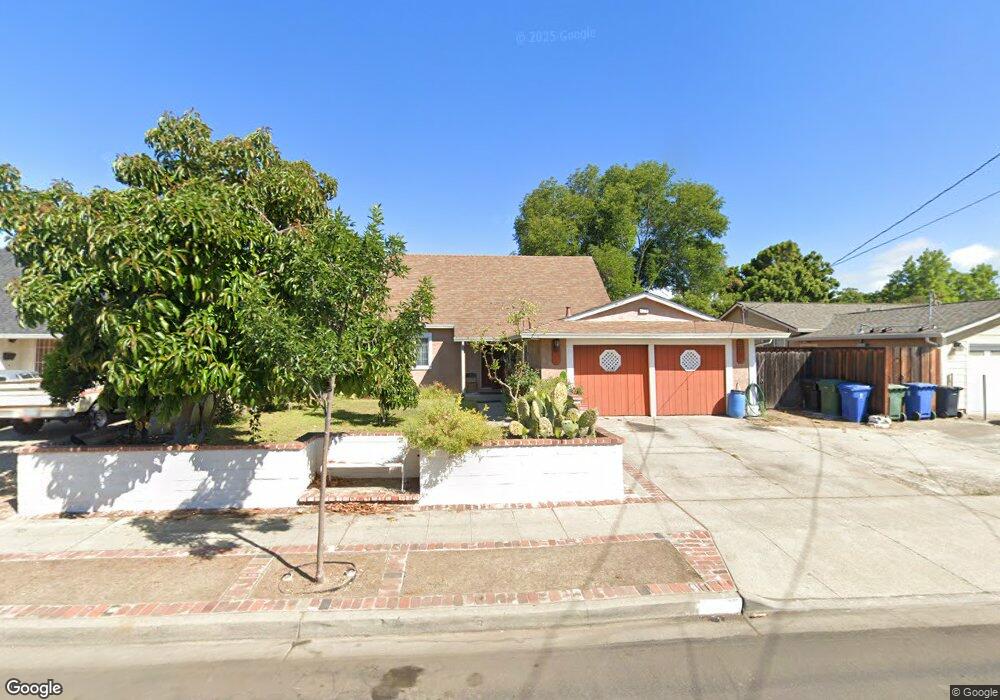
6213 Mayhews Landing Rd Newark, CA 94560
Estimated Value: $1,225,888 - $1,485,000
4
Beds
2
Baths
1,464
Sq Ft
$906/Sq Ft
Est. Value
About This Home
This home is located at 6213 Mayhews Landing Rd, Newark, CA 94560 and is currently estimated at $1,326,722, approximately $906 per square foot. 6213 Mayhews Landing Rd is a home located in Alameda County with nearby schools including Coyote Hills Elementary School, Newark Junior High School, and Newark Memorial High School.
Ownership History
Date
Name
Owned For
Owner Type
Purchase Details
Closed on
May 24, 2017
Sold by
Garcia Eliseo and Garcia Sergio
Bought by
Garcia Sergio
Current Estimated Value
Purchase Details
Closed on
Apr 1, 2001
Sold by
Garcia Javier and Garcia Leopoldo
Bought by
Garcia Sergio and Garcia Eliseo
Purchase Details
Closed on
Apr 24, 1996
Sold by
Saratoga Storage Systems Inc
Bought by
Garcia Garcia Javier Javier and Garcia Torres Leopoldo
Home Financials for this Owner
Home Financials are based on the most recent Mortgage that was taken out on this home.
Original Mortgage
$160,000
Outstanding Balance
$8,092
Interest Rate
8.12%
Estimated Equity
$1,318,630
Purchase Details
Closed on
Dec 28, 1995
Sold by
Baker Patricia A and Saratoga Storage Systems Inc
Bought by
Saratoga Storage Systems Inc
Create a Home Valuation Report for This Property
The Home Valuation Report is an in-depth analysis detailing your home's value as well as a comparison with similar homes in the area
Home Values in the Area
Average Home Value in this Area
Purchase History
| Date | Buyer | Sale Price | Title Company |
|---|---|---|---|
| Garcia Sergio | $125,000 | None Available | |
| Garcia Sergio | -- | -- | |
| Garcia Garcia Javier Javier | $168,500 | Chicago Title Co | |
| Saratoga Storage Systems Inc | $44,790 | Fidelity National Title Ins |
Source: Public Records
Mortgage History
| Date | Status | Borrower | Loan Amount |
|---|---|---|---|
| Open | Garcia Garcia Javier Javier | $160,000 |
Source: Public Records
Tax History Compared to Growth
Tax History
| Year | Tax Paid | Tax Assessment Tax Assessment Total Assessment is a certain percentage of the fair market value that is determined by local assessors to be the total taxable value of land and additions on the property. | Land | Improvement |
|---|---|---|---|---|
| 2025 | $8,438 | $679,372 | $232,645 | $453,727 |
| 2024 | $8,438 | $665,916 | $228,084 | $444,832 |
| 2023 | $8,208 | $659,723 | $223,612 | $436,111 |
| 2022 | $8,103 | $639,788 | $219,228 | $427,560 |
| 2021 | $7,900 | $627,108 | $214,930 | $419,178 |
| 2020 | $7,793 | $627,608 | $212,727 | $414,881 |
| 2019 | $7,680 | $615,306 | $208,557 | $406,749 |
| 2018 | $7,565 | $603,242 | $204,468 | $398,774 |
| 2017 | $5,245 | $402,831 | $120,919 | $281,912 |
| 2016 | $5,186 | $394,935 | $118,549 | $276,386 |
| 2015 | $5,169 | $389,004 | $116,769 | $272,235 |
| 2014 | $5,028 | $381,386 | $114,482 | $266,904 |
Source: Public Records
Map
Nearby Homes
- 36593 Leone St
- 6278 Dairy Ave
- 6364 Noel Ave
- 6125 Thornton Ave Unit A
- 36523 Cherry St
- 36913 Newark Blvd Unit C
- 5879 Caleb Ct
- 36535 Mulberry St
- 36702 Olive St
- 36976 Mulberry St
- 36466 Haley St
- 36563 Beutke Dr
- 6198 Civic Terrace Ave Unit A
- 36184 Toulouse St
- 5315 Port Sailwood Dr Unit 7
- 37136 Magnolia St
- 6831 Cabernet Ave
- 37282 Magnolia St
- 5447 Saint Mark Ave
- 36985 Walnut St
- 6221 Mayhews Landing Rd
- 6201 Mayhews Landing Rd
- 6218 Bellhaven Place
- 6210 Bellhaven Place
- 6229 Mayhews Landing Rd
- 6226 Bellhaven Place
- 36477 Peugeot Place
- 6202 Bellhaven Place
- 6214 Mayhews Landing Rd
- 6206 Mayhews Landing Rd
- 6222 Mayhews Landing Rd
- 6241 Mayhews Landing Rd
- 6194 Mayhews Landing Rd
- 6230 Mayhews Landing Rd
- 6234 Bellhaven Place
- 36495 Peugeot Place
- 36461 Peugeot Place
- 6176 Mayhews Landing Rd
- 6190 Bellhaven Place
- 6238 Mayhews Landing Rd