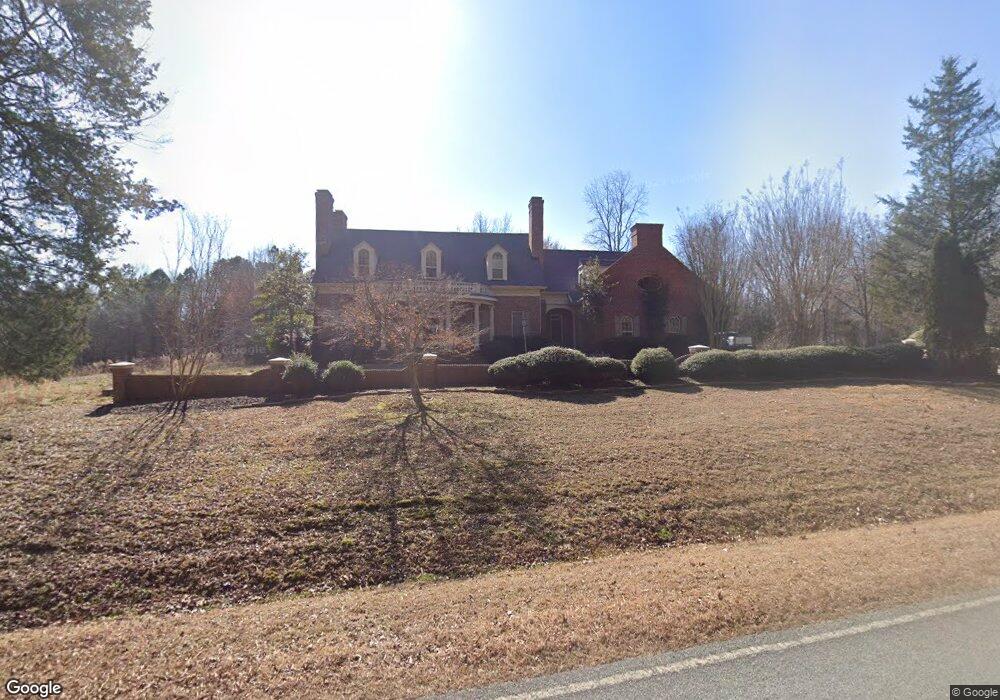
6215 Amed Rd Bahama, NC 27503
Estimated Value: $652,887 - $757,000
3
Beds
4
Baths
4,707
Sq Ft
$152/Sq Ft
Est. Value
About This Home
This home is located at 6215 Amed Rd, Bahama, NC 27503 and is currently estimated at $716,722, approximately $152 per square foot. 6215 Amed Rd is a home located in Durham County with nearby schools including Mangum Elementary School, Lucas Middle School, and Northern High School.
Ownership History
Date
Name
Owned For
Owner Type
Purchase Details
Closed on
Jul 2, 2013
Sold by
Wells Fargo Bank N A
Bought by
Cox Claiborn M and Cox Ellen N
Current Estimated Value
Home Financials for this Owner
Home Financials are based on the most recent Mortgage that was taken out on this home.
Original Mortgage
$284,903
Outstanding Balance
$211,985
Interest Rate
4.48%
Mortgage Type
New Conventional
Estimated Equity
$504,737
Purchase Details
Closed on
May 20, 2013
Sold by
Carden Bobby R and Carden Teresa F
Bought by
Wells Fargo Bank N A
Home Financials for this Owner
Home Financials are based on the most recent Mortgage that was taken out on this home.
Original Mortgage
$284,903
Outstanding Balance
$211,985
Interest Rate
4.48%
Mortgage Type
New Conventional
Estimated Equity
$504,737
Purchase Details
Closed on
May 16, 2011
Sold by
Carden Bobby R and Carden Teresa F
Bought by
Carden Bobby R
Create a Home Valuation Report for This Property
The Home Valuation Report is an in-depth analysis detailing your home's value as well as a comparison with similar homes in the area
Home Values in the Area
Average Home Value in this Area
Purchase History
| Date | Buyer | Sale Price | Title Company |
|---|---|---|---|
| Cox Claiborn M | $30,500 | None Available | |
| Wells Fargo Bank N A | $408,500 | None Available | |
| Carden Bobby R | -- | None Available |
Source: Public Records
Mortgage History
| Date | Status | Borrower | Loan Amount |
|---|---|---|---|
| Open | Cox Claiborn M | $284,903 |
Source: Public Records
Tax History Compared to Growth
Tax History
| Year | Tax Paid | Tax Assessment Tax Assessment Total Assessment is a certain percentage of the fair market value that is determined by local assessors to be the total taxable value of land and additions on the property. | Land | Improvement |
|---|---|---|---|---|
| 2025 | $5,900 | $875,220 | $113,016 | $762,204 |
| 2024 | $4,003 | $418,231 | $45,610 | $372,621 |
| 2023 | $3,792 | $418,231 | $45,610 | $372,621 |
| 2022 | $3,646 | $418,231 | $45,610 | $372,621 |
| 2021 | $3,433 | $418,231 | $45,610 | $372,621 |
| 2020 | $3,391 | $418,231 | $45,610 | $372,621 |
| 2019 | $3,391 | $418,231 | $45,610 | $372,621 |
| 2018 | $3,386 | $386,217 | $31,631 | $354,586 |
| 2017 | $3,347 | $386,217 | $31,631 | $354,586 |
| 2016 | $3,241 | $386,217 | $31,631 | $354,586 |
| 2015 | $4,220 | $457,621 | $38,972 | $418,649 |
| 2014 | $4,220 | $457,621 | $38,972 | $418,649 |
Source: Public Records
Map
Nearby Homes
- 6007 Brickhouse Rd
- 122 Loblolly Dr
- 614 Red Cedar Cir
- 310 Loblolly Dr
- 5 Loblolly Ct
- 125 Rhododendron Dr
- 8011 Old Trail Dr
- 105 Blackford Ct
- 20 Grandwood Cir
- 1126 Stonebridge Dr
- 1119 Stonebridge Dr
- 1211 E Pointe Dr
- 1711 W B St
- 6228 Old Tavern Dr
- 608 15th St
- 1213 Rocky Point Ln
- 105 Abbotsford Ct
- 213 12th St
- 309 14th St
- 1238 Champions Pointe Dr
- 6221 Amed Rd
- 7409 Old Oxford Rd
- 6404 Amed Rd
- 7413 Old Oxford Hwy
- 7415 Old Oxford Hwy
- 7403 Old Oxford Rd
- 7403 Old Oxford Hwy
- 7309 Old Oxford Hwy
- 6713 Amed Rd
- 00 Amed Rd
- 6713 Amed Rd Unit 6713
- 6796 Amed Rd
- 7510 Old Oxford Rd
- 7353 Old Oxford Hwy
- 6410 Amed Rd
- 6420 Amed Rd
- 6416 Amed Rd
- 7119 Old Oxford Hwy
- 7119 Old Oxford Hwy
- 0 Brickhouse Rd Unit 1926445