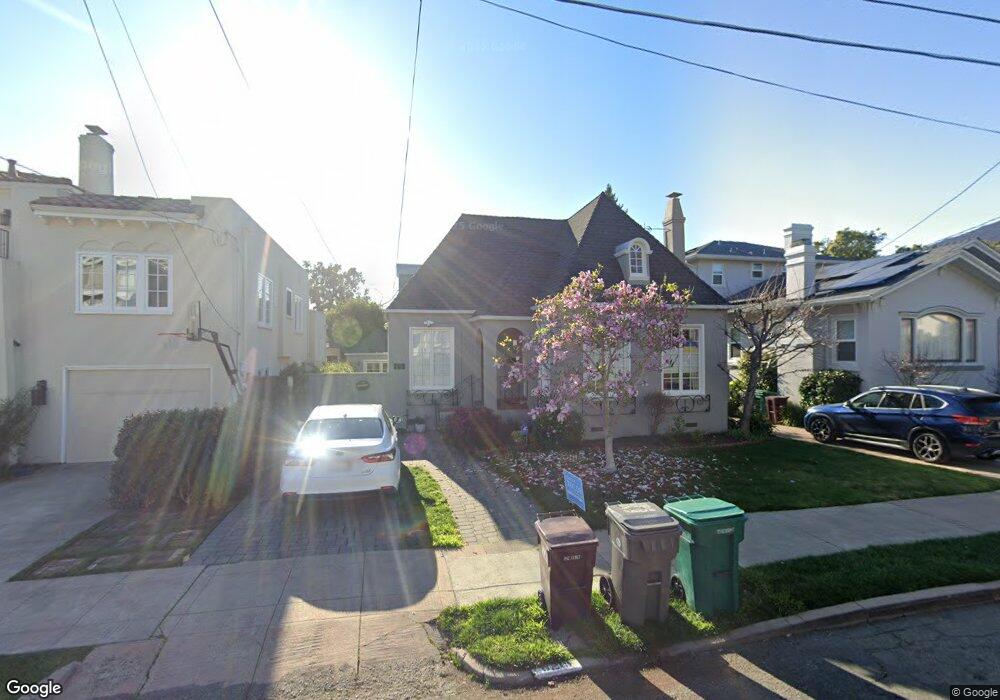
6215 Manoa St Oakland, CA 94618
Rockridge NeighborhoodEstimated Value: $1,473,373 - $2,225,000
3
Beds
2
Baths
1,415
Sq Ft
$1,319/Sq Ft
Est. Value
About This Home
This home is located at 6215 Manoa St, Oakland, CA 94618 and is currently estimated at $1,866,343, approximately $1,318 per square foot. 6215 Manoa St is a home located in Alameda County with nearby schools including Chabot Elementary School, Claremont Middle School, and Oakland Technical High School.
Ownership History
Date
Name
Owned For
Owner Type
Purchase Details
Closed on
Jan 2, 2026
Sold by
Cohler Ellen and Ellen A Cohler Revocable Trust
Bought by
Ellen A Cohler Revocable Trust and Cohler
Current Estimated Value
Home Financials for this Owner
Home Financials are based on the most recent Mortgage that was taken out on this home.
Original Mortgage
$3,044,400
Outstanding Balance
$3,043,864
Interest Rate
6.23%
Mortgage Type
Reverse Mortgage Home Equity Conversion Mortgage
Estimated Equity
-$1,177,521
Purchase Details
Closed on
Dec 1, 2011
Sold by
Cohler Ellen A
Bought by
Cohler Ellen A and The Ellena Cohler Revocable Tr
Purchase Details
Closed on
Aug 3, 2010
Sold by
Hovland Kari and Hovland Kari J
Bought by
Cohler Ellen A
Purchase Details
Closed on
Dec 20, 2006
Sold by
Meza Frank G and Fosdal Sandra K
Bought by
Hovland Kari and Bennett Marjorie A
Home Financials for this Owner
Home Financials are based on the most recent Mortgage that was taken out on this home.
Original Mortgage
$550,000
Interest Rate
5.87%
Mortgage Type
Purchase Money Mortgage
Purchase Details
Closed on
Jun 6, 2005
Sold by
Myers Helen B
Bought by
Myers Helen B
Home Financials for this Owner
Home Financials are based on the most recent Mortgage that was taken out on this home.
Original Mortgage
$469,342
Interest Rate
5.02%
Mortgage Type
FHA
Create a Home Valuation Report for This Property
The Home Valuation Report is an in-depth analysis detailing your home's value as well as a comparison with similar homes in the area
Home Values in the Area
Average Home Value in this Area
Purchase History
| Date | Buyer | Sale Price | Title Company |
|---|---|---|---|
| Ellen A Cohler Revocable Trust | -- | Summit Settlement Services | |
| Cohler Ellen A | -- | None Available | |
| Cohler Ellen A | $975,000 | Old Republic Title Company | |
| Hovland Kari | $901,000 | First American Title Co | |
| Myers Helen B | -- | North American Title Co |
Source: Public Records
Mortgage History
| Date | Status | Borrower | Loan Amount |
|---|---|---|---|
| Open | Ellen A Cohler Revocable Trust | $3,044,400 | |
| Previous Owner | Hovland Kari | $550,000 | |
| Previous Owner | Myers Helen B | $469,342 |
Source: Public Records
Tax History
| Year | Tax Paid | Tax Assessment Tax Assessment Total Assessment is a certain percentage of the fair market value that is determined by local assessors to be the total taxable value of land and additions on the property. | Land | Improvement |
|---|---|---|---|---|
| 2025 | $3,889 | $164,589 | $97,552 | $74,037 |
| 2024 | $3,889 | $161,225 | $95,639 | $72,586 |
| 2023 | $3,974 | $164,927 | $93,764 | $71,163 |
| 2022 | $3,807 | $154,694 | $91,926 | $69,768 |
| 2021 | $3,507 | $151,524 | $90,124 | $68,400 |
| 2020 | $3,491 | $156,900 | $89,201 | $67,699 |
| 2019 | $3,277 | $153,824 | $87,452 | $66,372 |
| 2018 | $3,211 | $150,809 | $85,738 | $65,071 |
| 2017 | $3,058 | $147,852 | $84,057 | $63,795 |
| 2016 | $2,878 | $144,954 | $82,409 | $62,545 |
| 2015 | $2,858 | $142,778 | $81,172 | $61,606 |
| 2014 | $2,791 | $139,982 | $79,583 | $60,399 |
Source: Public Records
Map
Nearby Homes
- 6100 Chabot Rd
- 5910 Chabot Rd
- 360 Alcatraz Ave
- 2800 Prince St
- 5936 Broadway
- 6189 Margarido Dr
- 6446 Colby St
- 2477 Prince St
- 2962 Piedmont Ave
- 5570 Taft Ave
- 5466 Shafter Ave
- 5883 Margarido Dr
- 5499 Claremont Ave
- 204 El Camino Real
- 491 Mcauley St
- 362 Hudson St
- 2935 Florence St
- 5710 Margarido Dr
- 2917 Telegraph Ave
- 5668 Buena Vista Ave
Your Personal Tour Guide
Ask me questions while you tour the home.