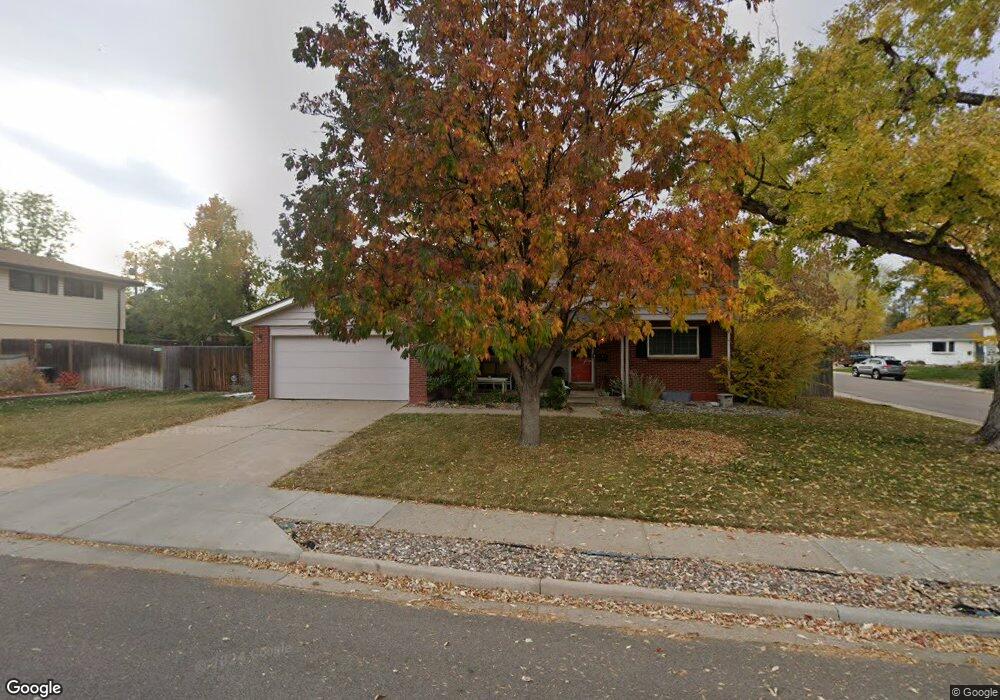
6215 S Cook St Centennial, CO 80121
West Centennial NeighborhoodEstimated Value: $608,517 - $681,000
4
Beds
3
Baths
2,637
Sq Ft
$243/Sq Ft
Est. Value
About This Home
This home is located at 6215 S Cook St, Centennial, CO 80121 and is currently estimated at $640,629, approximately $242 per square foot. 6215 S Cook St is a home located in Arapahoe County with nearby schools including Lois Lenski Elementary School, Newton Middle School, and Littleton High School.
Ownership History
Date
Name
Owned For
Owner Type
Purchase Details
Closed on
Jul 17, 2013
Sold by
Hansen Family Trust Division B
Bought by
Short Matthew D and Short Lesley A
Current Estimated Value
Home Financials for this Owner
Home Financials are based on the most recent Mortgage that was taken out on this home.
Original Mortgage
$252,000
Outstanding Balance
$181,613
Interest Rate
3.94%
Mortgage Type
New Conventional
Estimated Equity
$459,016
Purchase Details
Closed on
Sep 10, 2003
Sold by
Hansen Kris T and Hansen Patricia A
Bought by
Hansen Family Trust Division 8
Purchase Details
Closed on
Aug 25, 2003
Sold by
Kittelson Robert L and Kittelson Alpha J
Bought by
Hansen Kris T and Hansen Patricia A
Purchase Details
Closed on
Jul 4, 1776
Bought by
Conversion Arapco
Create a Home Valuation Report for This Property
The Home Valuation Report is an in-depth analysis detailing your home's value as well as a comparison with similar homes in the area
Home Values in the Area
Average Home Value in this Area
Purchase History
| Date | Buyer | Sale Price | Title Company |
|---|---|---|---|
| Short Matthew D | $315,000 | Heritage Title | |
| Hansen Family Trust Division 8 | -- | -- | |
| Hansen Kris T | $252,477 | -- | |
| Conversion Arapco | -- | -- |
Source: Public Records
Mortgage History
| Date | Status | Borrower | Loan Amount |
|---|---|---|---|
| Open | Short Matthew D | $252,000 |
Source: Public Records
Tax History
| Year | Tax Paid | Tax Assessment Tax Assessment Total Assessment is a certain percentage of the fair market value that is determined by local assessors to be the total taxable value of land and additions on the property. | Land | Improvement |
|---|---|---|---|---|
| 2025 | $4,549 | $39,413 | -- | -- |
| 2024 | $4,549 | $39,698 | -- | -- |
| 2023 | $4,267 | $39,698 | $0 | $0 |
| 2022 | $3,707 | $32,436 | $0 | $0 |
| 2021 | $3,705 | $32,436 | $0 | $0 |
| 2020 | $3,216 | $28,850 | $0 | $0 |
| 2019 | $3,044 | $28,850 | $0 | $0 |
| 2018 | $2,702 | $25,733 | $0 | $0 |
| 2017 | $2,495 | $25,733 | $0 | $0 |
| 2016 | $2,383 | $23,705 | $0 | $0 |
| 2015 | $2,386 | $23,705 | $0 | $0 |
| 2014 | -- | $20,378 | $0 | $0 |
| 2013 | -- | $19,720 | $0 | $0 |
Source: Public Records
Map
Nearby Homes
- 6272 S Garfield Dr
- 3512 E Lake Way
- 6139 S Adams Dr
- 6064 S Steele St
- 6428 S Steele St
- 6034 S Steele St
- 6570 S Madison Ct
- 6071 S Detroit St
- 6516 S Garfield Ct
- 6226 S Ash Cir E
- 2569 E Cresthill Ave
- 3637 E Euclid Ave
- 3871 E Euclid Ave
- 4212 E Orchard Place
- 4318 E Maplewood Way
- 4262 E Orchard Place
- 4367 E Maplewood Way
- 4233 E Maplewood Way
- 6097 S Elizabeth Way
- 4319 E Peakview Cir
- 6235 S Cook St
- 6224 S Cook Dr
- 6203 S Cook Dr
- 6244 S Cook Dr
- 6226 S Cook St
- 6213 S Cook Dr
- 6255 S Cook St
- 6206 S Cook St
- 6246 S Cook St
- 6223 S Cook Dr
- 6254 S Cook Dr
- 6256 S Cook St
- 6196 S Cook St
- 6233 S Cook Dr
- 3427 E Fair Place
- 6202 S Adams Dr
- 6212 S Adams Dr
- 6243 S Cook Dr
- 6227 S Madison Dr
- 3407 E Fair Place
Your Personal Tour Guide
Ask me questions while you tour the home.