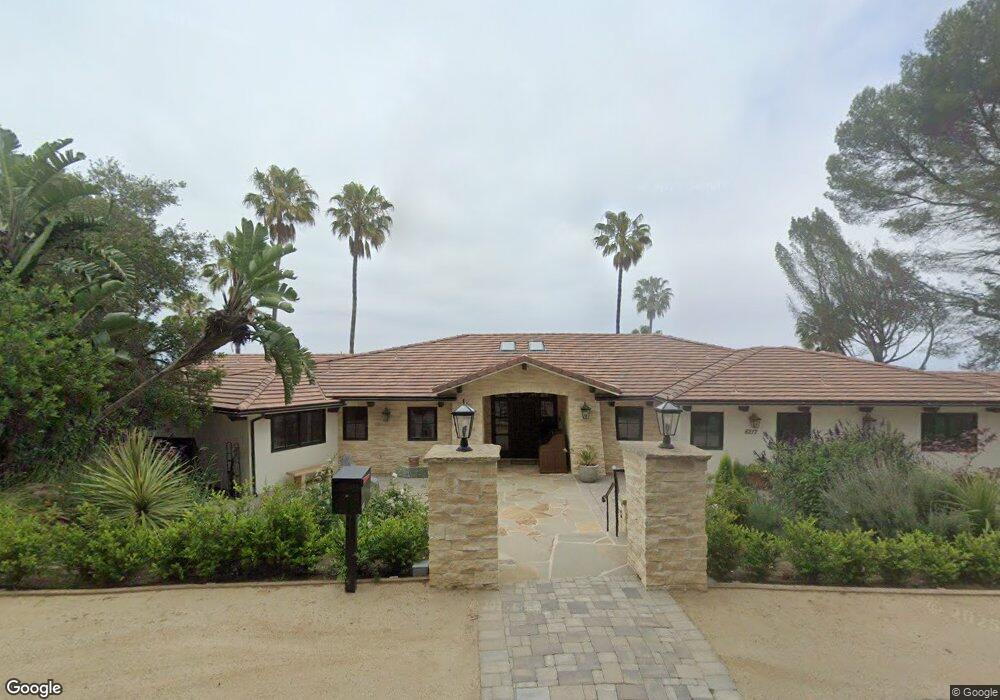
6217 Via Subida Rancho Palos Verdes, CA 90275
Estimated Value: $2,925,000 - $3,865,435
5
Beds
5
Baths
3,689
Sq Ft
$921/Sq Ft
Est. Value
About This Home
This home is located at 6217 Via Subida, Rancho Palos Verdes, CA 90275 and is currently estimated at $3,399,109, approximately $921 per square foot. 6217 Via Subida is a home located in Los Angeles County with nearby schools including Mira Catalina Elementary School, Miraleste Intermediate, and Palos Verdes Peninsula High School.
Ownership History
Date
Name
Owned For
Owner Type
Purchase Details
Closed on
Oct 21, 2002
Sold by
Parsa Khosrow P and Parsa Farzaneh
Bought by
Meek John S and Meek Wendy O
Current Estimated Value
Home Financials for this Owner
Home Financials are based on the most recent Mortgage that was taken out on this home.
Original Mortgage
$700,000
Interest Rate
6.28%
Purchase Details
Closed on
Oct 29, 1993
Sold by
Parsa Khosrow Peter and Parsa Farzaneh
Bought by
Parsa Khosrow P and Parsa Farzaneh
Home Financials for this Owner
Home Financials are based on the most recent Mortgage that was taken out on this home.
Original Mortgage
$367,000
Interest Rate
6.97%
Purchase Details
Closed on
Aug 20, 1993
Sold by
Parsa Khosrow P
Bought by
Parsa Khosrow Peter and Parsa Farzaneh
Create a Home Valuation Report for This Property
The Home Valuation Report is an in-depth analysis detailing your home's value as well as a comparison with similar homes in the area
Home Values in the Area
Average Home Value in this Area
Purchase History
| Date | Buyer | Sale Price | Title Company |
|---|---|---|---|
| Meek John S | $1,550,000 | Ltc | |
| Parsa Khosrow P | -- | Provident Title | |
| Parsa Khosrow Peter | -- | -- |
Source: Public Records
Mortgage History
| Date | Status | Borrower | Loan Amount |
|---|---|---|---|
| Previous Owner | Meek John S | $700,000 | |
| Previous Owner | Parsa Khosrow P | $367,000 |
Source: Public Records
Tax History Compared to Growth
Tax History
| Year | Tax Paid | Tax Assessment Tax Assessment Total Assessment is a certain percentage of the fair market value that is determined by local assessors to be the total taxable value of land and additions on the property. | Land | Improvement |
|---|---|---|---|---|
| 2025 | $31,358 | $2,798,278 | $1,520,746 | $1,277,532 |
| 2024 | $31,358 | $2,743,411 | $1,490,928 | $1,252,483 |
| 2023 | $30,834 | $2,689,620 | $1,461,695 | $1,227,925 |
| 2022 | $29,222 | $2,636,884 | $1,433,035 | $1,203,849 |
| 2021 | $29,145 | $2,585,182 | $1,404,937 | $1,180,245 |
| 2019 | $22,638 | $2,012,437 | $1,363,267 | $649,170 |
| 2018 | $22,355 | $1,972,979 | $1,336,537 | $636,442 |
| 2017 | $21,897 | $1,934,294 | $1,310,331 | $623,963 |
| 2016 | $21,231 | $1,896,368 | $1,284,639 | $611,729 |
| 2015 | $21,180 | $1,867,884 | $1,265,343 | $602,541 |
| 2014 | $20,898 | $1,831,296 | $1,240,557 | $590,739 |
Source: Public Records
Map
Nearby Homes
- 6309 Via Colinita
- 6337 Via Colinita
- 8 Via Subida
- 29857 Knoll View Dr
- 6401 Corsini Place
- 4329 Via Frascati
- 30229 Kingsridge Dr
- 30040 Grandpoint Ln
- 29815 Knoll View Dr
- 6604 Via Siena
- 6608 Via Siena
- 314 S Miraleste Dr Unit 116
- 322 S Miraleste Dr Unit 176
- 308 S Miraleste Dr Unit 57
- 1971 W Santa Cruz St
- 3423 Newridge Dr
- 1460 W Sunrise Ln
- 1642 Saratoga Ln
- 3111 Deluna Dr
- 2063 Chandeleur Dr
- 6215 Via Subida
- 6212 Via Subida
- 4504 Palos Verdes Dr E
- 4512 Palos Verdes Dr E
- 6209 Via Subida
- 4500 Palos Verdes Dr E
- 6308 Via Colinita
- 4516 Palos Verdes Dr E
- 6324 Via Colinita
- 6200 Via Subida
- 6205 Via Subida
- 6216 Via Subida
- 4400 Palos Verdes Dr E
- 6325 Via Colinita
- 6321 Via Colinita
- 4520 Palos Verdes Dr E
- 4525 Palos Verdes Dr E
- 6317 Via Colinita
- 6340 Via Colinita