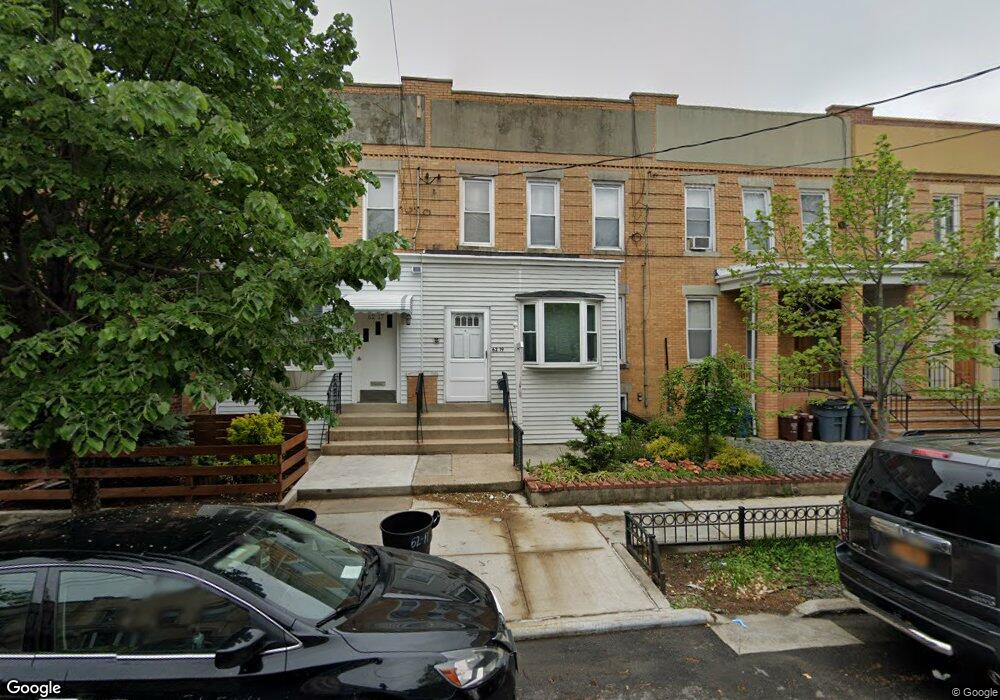
6219 60th Dr Maspeth, NY 11378
Maspeth NeighborhoodEstimated Value: $796,430 - $1,071,000
Studio
--
Bath
2,040
Sq Ft
$473/Sq Ft
Est. Value
About This Home
This home is located at 6219 60th Dr, Maspeth, NY 11378 and is currently estimated at $965,608, approximately $473 per square foot. 6219 60th Dr is a home located in Queens County with nearby schools including P.S. 153 Maspeth, IS 73 - The Frank Sansivieri School, and Grover Cleveland High School.
Ownership History
Date
Name
Owned For
Owner Type
Purchase Details
Closed on
May 28, 2021
Sold by
Adams Karen and Grunenberg Geraldine
Bought by
Cocha Jose Luis and Pombosa Soledad Analuisa
Current Estimated Value
Home Financials for this Owner
Home Financials are based on the most recent Mortgage that was taken out on this home.
Original Mortgage
$714,285
Outstanding Balance
$646,696
Interest Rate
2.9%
Mortgage Type
Purchase Money Mortgage
Estimated Equity
$318,912
Create a Home Valuation Report for This Property
The Home Valuation Report is an in-depth analysis detailing your home's value as well as a comparison with similar homes in the area
Home Values in the Area
Average Home Value in this Area
Purchase History
| Date | Buyer | Sale Price | Title Company |
|---|---|---|---|
| Cocha Jose Luis | $780,000 | -- |
Source: Public Records
Mortgage History
| Date | Status | Borrower | Loan Amount |
|---|---|---|---|
| Open | Cocha Jose Luis | $714,285 |
Source: Public Records
Tax History
| Year | Tax Paid | Tax Assessment Tax Assessment Total Assessment is a certain percentage of the fair market value that is determined by local assessors to be the total taxable value of land and additions on the property. | Land | Improvement |
|---|---|---|---|---|
| 2025 | $7,676 | $39,814 | $5,125 | $34,689 |
| 2024 | $7,676 | $38,219 | $5,893 | $32,326 |
| 2023 | $7,397 | $36,826 | $5,072 | $31,754 |
| 2022 | $7,020 | $51,480 | $8,040 | $43,440 |
| 2021 | $2,529 | $48,120 | $8,040 | $40,080 |
| 2020 | $2,548 | $51,120 | $8,040 | $43,080 |
| 2019 | $2,371 | $48,720 | $8,040 | $40,680 |
| 2018 | $2,175 | $30,688 | $4,804 | $25,884 |
| 2017 | $2,165 | $29,306 | $6,293 | $23,013 |
| 2016 | $1,967 | $29,306 | $6,293 | $23,013 |
| 2015 | $1,138 | $27,648 | $7,078 | $20,570 |
| 2014 | $1,138 | $26,541 | $7,724 | $18,817 |
Source: Public Records
Map
Nearby Homes
- 62-18 60th Dr
- 61-06 60th Dr
- 60-23 61st St
- 62-63 60th Dr
- 6161 62nd Ave
- 61-24 65th St
- 5974 Fresh Pond Rd
- 61-05 65th St
- 60-58 60th Rd
- 60-28 60th Place
- 64-41 60th Ave
- 5911 Fresh Pond Rd
- 60-14 60th Ave
- 60-66 60th St
- 6334 Fresh Pond Rd Unit 5C
- 5803 Metropolitan Ave
- 56-18 62nd Ave
- 5631 Metropolitan Ave
- 6451 59th Ave
- 6167 56th St
- 62-19 60th Dr
- 6221 60th Dr Unit 1fl
- 6221 60th Dr
- 6217 60th Dr
- 6223 60th Dr
- 6213 60th Dr
- 62-25 60th Dr
- 6225 60th Dr
- 6227 60th Dr
- 6220 60th Rd
- 6045 Fresh Pond Rd
- 6047 Fresh Pond Rd
- 6229 60th Dr
- 6049 Fresh Pond Rd
- 6224 60th Rd
- 6043 Fresh Pond Rd
- 6041 Fresh Pond Rd
- 6051 Fresh Pond Rd
- 6228 60th Rd
- 60-47 Fresh Pond Rd Unit Storefront
Your Personal Tour Guide
Ask me questions while you tour the home.