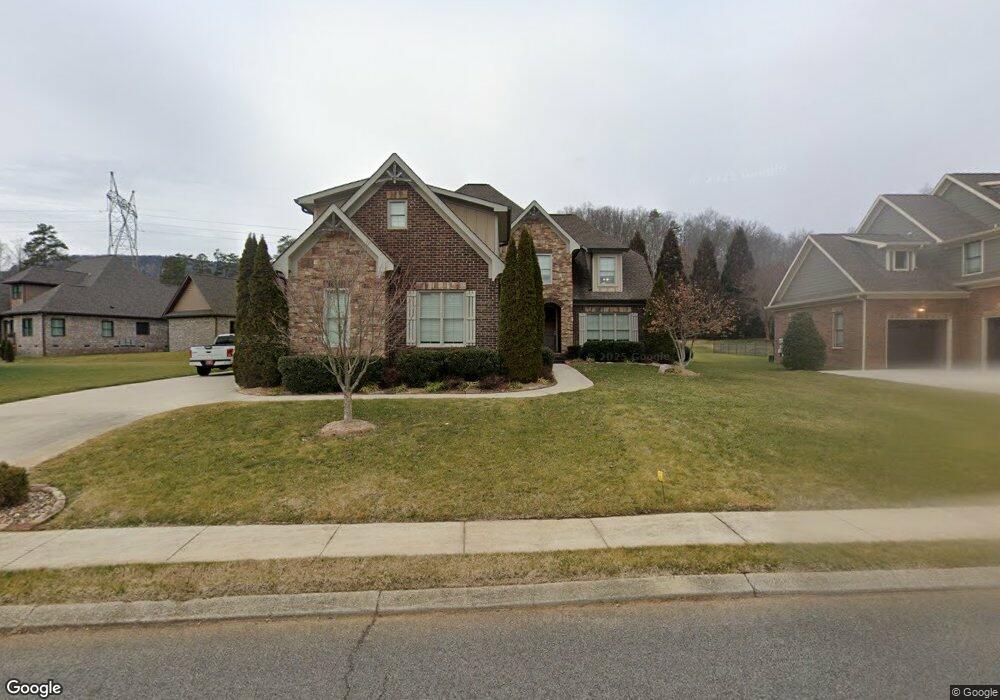
6219 Deep Canyon Rd Unit Lot 27 Hixson, TN 37343
Falling Water NeighborhoodEstimated Value: $813,000 - $859,000
--
Bed
4
Baths
3,210
Sq Ft
$260/Sq Ft
Est. Value
About This Home
This home is located at 6219 Deep Canyon Rd Unit Lot 27, Hixson, TN 37343 and is currently estimated at $835,626, approximately $260 per square foot. 6219 Deep Canyon Rd Unit Lot 27 is a home located in Hamilton County with nearby schools including Ganns Middle Valley Elementary School, Red Bank Middle School, and Red Bank High School.
Ownership History
Date
Name
Owned For
Owner Type
Purchase Details
Closed on
Sep 28, 2018
Sold by
Martin Kristin G and Martin Tyler
Bought by
Sneckenberger Michael and Sneckenberger Lyndsay
Current Estimated Value
Home Financials for this Owner
Home Financials are based on the most recent Mortgage that was taken out on this home.
Original Mortgage
$384,000
Outstanding Balance
$334,871
Interest Rate
4.5%
Mortgage Type
New Conventional
Estimated Equity
$500,755
Purchase Details
Closed on
May 11, 2016
Sold by
G T Issa Construction
Bought by
Martin Eric and Martin Kristin
Home Financials for this Owner
Home Financials are based on the most recent Mortgage that was taken out on this home.
Original Mortgage
$417,000
Interest Rate
3.61%
Purchase Details
Closed on
Feb 28, 2014
Sold by
I Canyons Llc
Bought by
G T Issa Constructions Llc
Create a Home Valuation Report for This Property
The Home Valuation Report is an in-depth analysis detailing your home's value as well as a comparison with similar homes in the area
Home Values in the Area
Average Home Value in this Area
Purchase History
| Date | Buyer | Sale Price | Title Company |
|---|---|---|---|
| Sneckenberger Michael | $480,000 | None Available | |
| Martin Eric | -- | -- | |
| G T Issa Constructions Llc | $55,000 | Warranty Title Ins Co Inc |
Source: Public Records
Mortgage History
| Date | Status | Borrower | Loan Amount |
|---|---|---|---|
| Open | Sneckenberger Michael | $384,000 | |
| Previous Owner | Martin Eric | $417,000 | |
| Previous Owner | Martin Eric | -- |
Source: Public Records
Tax History Compared to Growth
Tax History
| Year | Tax Paid | Tax Assessment Tax Assessment Total Assessment is a certain percentage of the fair market value that is determined by local assessors to be the total taxable value of land and additions on the property. | Land | Improvement |
|---|---|---|---|---|
| 2024 | $2,817 | $125,925 | $0 | $0 |
| 2023 | $2,826 | $125,925 | $0 | $0 |
| 2022 | $2,826 | $125,925 | $0 | $0 |
| 2021 | $2,826 | $125,925 | $0 | $0 |
| 2020 | $3,087 | $111,300 | $0 | $0 |
| 2019 | $3,087 | $111,300 | $0 | $0 |
| 2018 | $3,087 | $111,300 | $0 | $0 |
| 2017 | $3,087 | $111,300 | $0 | $0 |
| 2016 | $2,775 | $0 | $0 | $0 |
| 2015 | $2,766 | $100,025 | $0 | $0 |
| 2014 | $311 | $0 | $0 | $0 |
Source: Public Records
Map
Nearby Homes
- 5940 Sunset Canyon Dr
- 598 Blue Canyon Ln
- 595 Deer Valley Dr
- 805 Pickett Gulf Rd
- 733 Ray Ln
- 792 Sawmill Trail
- 6016&6014 Browntown Rd
- 0 Dayton Blvd Unit RTC2802699
- 0 Dayton Blvd Unit 1508885
- 311 Roberts Mill Rd
- 101 La Porte Dr
- 5977 Crestview Dr
- 311 Branch Dr
- 434 Stoneridge Dr
- 0 Rocky Ledge Rd Unit 1514267
- 855 Split Rock Trail
- 100 Pine Cone Ln
- 5839 Dayton Blvd
- 1000 Sawyer Cemetery Rd
- 107 Pine Forest Ln
- 6219 Deep Canyon Rd
- 6233 Deep Canyon Rd
- 6205 Deep Canyon Rd
- 6205 Deep Canyon Rd Unit LOT 28
- 7705 Canyon Crest
- 6218 Deep Canyon Rd Unit 37
- 6218 Deep Canyon Rd
- 6232 Deep Canyon Rd
- 595 Canyon Springs Dr Unit 24
- 595 Canyon Springs Dr
- 6204 Deep Canyon Rd
- 6191 Deep Canyon Rd
- 6191 Deep Canyon Rd Unit LOT 29
- 6190 Deep Canyon Rd Unit Lot 35
- 6190 Deep Canyon Rd
- 530 Pitts Rd
- 6213 Dry Canyon Ln
- 6225 Dry Canyon Ln Unit Lot 42
- 6177 Deep Canyon Rd
- 6261 Deep Canyon Rd