Estimated Value: $337,693 - $372,000
3
Beds
2
Baths
1,900
Sq Ft
$187/Sq Ft
Est. Value
About This Home
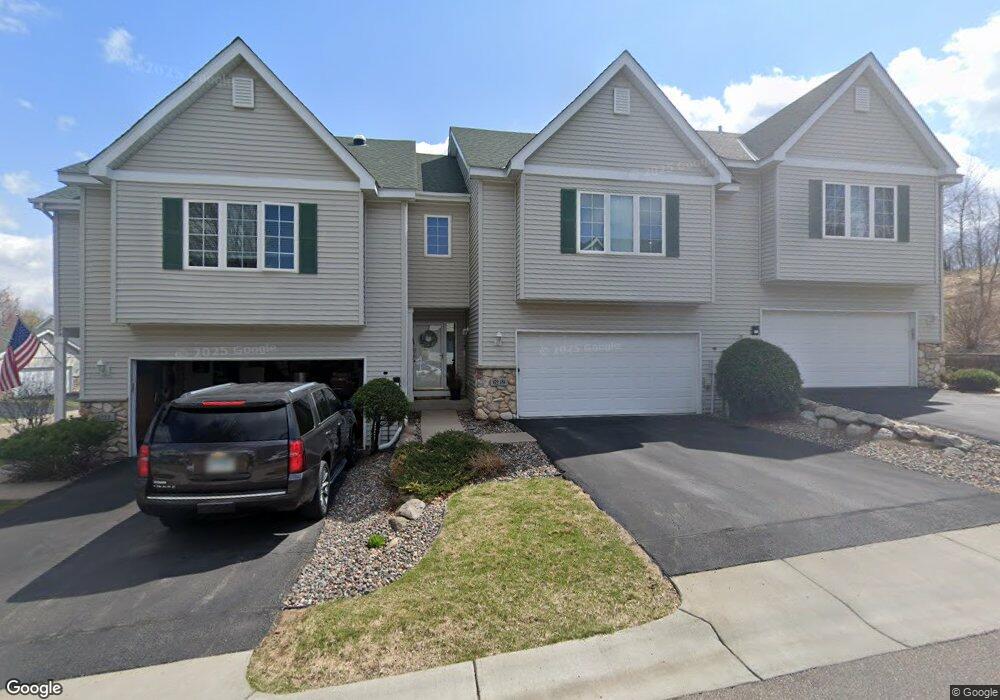
This home is located at 6219 Upland Ln N, Osseo, MN 55311 and is currently estimated at $356,173, approximately $187 per square foot. 6219 Upland Ln N is a home located in Hennepin County with nearby schools including Meadow Ridge Elementary School, Wayzata Central Middle School, and Wayzata High School.
Ownership History
Date
Name
Owned For
Owner Type
Purchase Details
Closed on
Dec 10, 2020
Sold by
Dorn Bryan J and Dorn Emily
Bought by
Dorn Bryan J and Dorn Emily
Current Estimated Value
Home Financials for this Owner
Home Financials are based on the most recent Mortgage that was taken out on this home.
Original Mortgage
$146,750
Outstanding Balance
$130,651
Interest Rate
2.7%
Mortgage Type
New Conventional
Estimated Equity
$225,522
Purchase Details
Closed on
Sep 23, 2009
Sold by
E Trade Bank
Bought by
Dorn Bryan J
Purchase Details
Closed on
May 13, 2005
Sold by
Samuels Michael G
Bought by
Wahl James D
Purchase Details
Closed on
Jul 21, 2000
Sold by
Welles Woods Llp
Bought by
Samuels Michael G
Create a Home Valuation Report for This Property
The Home Valuation Report is an in-depth analysis detailing your home's value as well as a comparison with similar homes in the area
Home Values in the Area
Average Home Value in this Area
Purchase History
| Date | Buyer | Sale Price | Title Company |
|---|---|---|---|
| Dorn Bryan J | -- | Pillar Title Services | |
| Dorn Bryan J | $190,000 | -- | |
| Wahl James D | $260,000 | -- | |
| Samuels Michael G | $224,900 | -- |
Source: Public Records
Mortgage History
| Date | Status | Borrower | Loan Amount |
|---|---|---|---|
| Open | Dorn Bryan J | $146,750 |
Source: Public Records
Tax History Compared to Growth
Tax History
| Year | Tax Paid | Tax Assessment Tax Assessment Total Assessment is a certain percentage of the fair market value that is determined by local assessors to be the total taxable value of land and additions on the property. | Land | Improvement |
|---|---|---|---|---|
| 2024 | $4,282 | $350,400 | $51,000 | $299,400 |
| 2023 | $4,071 | $348,400 | $61,800 | $286,600 |
| 2022 | $3,696 | $333,600 | $44,500 | $289,100 |
| 2021 | $3,737 | $272,600 | $34,500 | $238,100 |
| 2020 | $3,636 | $273,400 | $34,400 | $239,000 |
| 2019 | $3,231 | $275,200 | $43,800 | $231,400 |
| 2018 | $3,227 | $241,100 | $31,000 | $210,100 |
| 2017 | $2,878 | $208,500 | $45,000 | $163,500 |
| 2016 | $2,742 | $193,500 | $43,000 | $150,500 |
| 2015 | $2,637 | $182,200 | $36,000 | $146,200 |
| 2014 | -- | $157,500 | $36,000 | $121,500 |
Source: Public Records
Map
Nearby Homes
- 6225 Vicksburg Ln N
- 16370 62nd Place N
- 6336 Yuma Ln N
- 11100 Black Oaks Ln N
- 11020 Black Oaks Ln N
- 11050 Black Oaks Ln N
- 16600 61st Ave N
- 6413 Archer Ln N
- 16745 58th Ave N
- 6386 Minnesota Ln N
- 5865 Comstock Ln N
- 5690 Zanzibar Ln N
- 6324 Fountain Ln N
- 5895 Garland Ln N
- 5510 Weston Ln N
- 15097 67th Place N
- 6848 Polaris Ln N
- 16130 53rd Place N
- 6170 Dallas Ln N
- 6726 Fountain Ln N
- 6221 Upland Ln N
- 6217 Upland Ln N
- 6215 Upland Ln N
- 6213 Upland Ln N
- 6225 Upland Ln N
- 6229 Upland Ln N
- 6223 Upland Ln N
- 6223 Upland Ln N
- 6211 Upland Ln N
- 6231 Upland Ln N
- 6220 Upland Ln N
- 6218 Upland Ln N
- 6222 Upland Ln N
- 6233 Upland Ln N
- 6216 Upland Ln N
- 6214 Upland Ln N
- 6235 Upland Ln N
- 6212 Upland Ln N
- 6237 Upland Ln N
- 6210 Upland Ln N