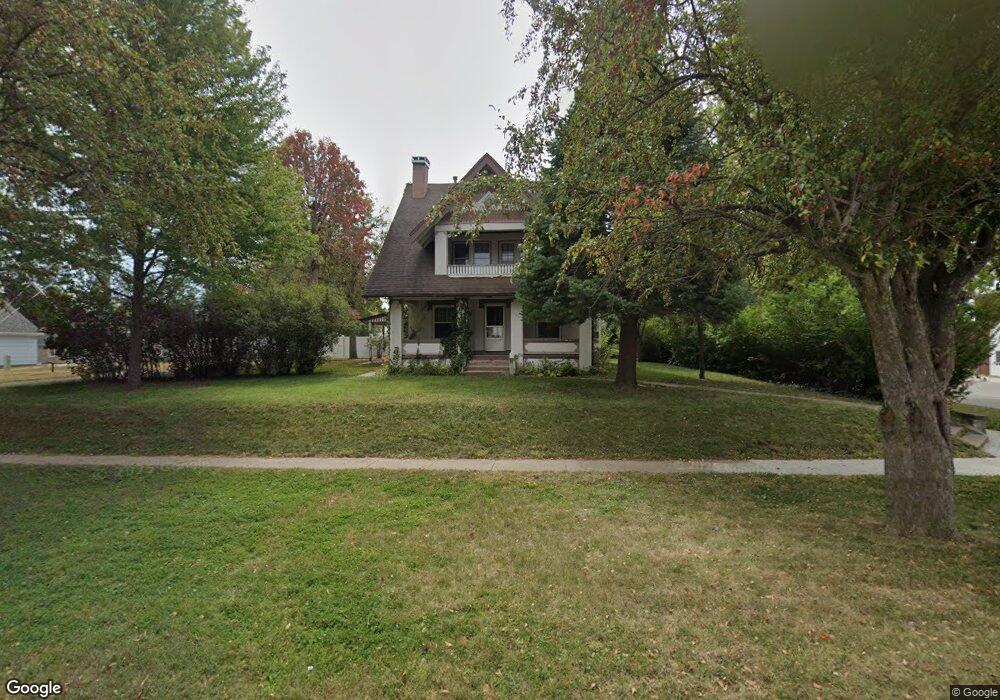
622 3rd St Manning, IA 51455
Estimated Value: $120,000 - $234,000
5
Beds
4
Baths
1,636
Sq Ft
$94/Sq Ft
Est. Value
About This Home
This home is located at 622 3rd St, Manning, IA 51455 and is currently estimated at $153,931, approximately $94 per square foot. 622 3rd St is a home with nearby schools including IKM-Manning Middle School, Ikm-Manning High School, and Irwin Elementary School.
Ownership History
Date
Name
Owned For
Owner Type
Purchase Details
Closed on
Oct 20, 2014
Sold by
Peters Danny L and Peters Lois J
Bought by
Mcmanigal Thomas P
Current Estimated Value
Home Financials for this Owner
Home Financials are based on the most recent Mortgage that was taken out on this home.
Original Mortgage
$63,750
Outstanding Balance
$48,838
Interest Rate
4.08%
Mortgage Type
Future Advance Clause Open End Mortgage
Estimated Equity
$105,093
Create a Home Valuation Report for This Property
The Home Valuation Report is an in-depth analysis detailing your home's value as well as a comparison with similar homes in the area
Purchase History
| Date | Buyer | Sale Price | Title Company |
|---|---|---|---|
| Mcmanigal Thomas P | $75,000 | None Available |
Source: Public Records
Mortgage History
| Date | Status | Borrower | Loan Amount |
|---|---|---|---|
| Open | Mcmanigal Thomas P | $63,750 |
Source: Public Records
Tax History
| Year | Tax Paid | Tax Assessment Tax Assessment Total Assessment is a certain percentage of the fair market value that is determined by local assessors to be the total taxable value of land and additions on the property. | Land | Improvement |
|---|---|---|---|---|
| 2025 | $1,786 | $103,080 | $16,180 | $86,900 |
| 2024 | $17 | $86,050 | $16,180 | $69,870 |
| 2023 | $1,873 | $86,050 | $16,180 | $69,870 |
| 2022 | $1,853 | $80,770 | $12,410 | $68,360 |
| 2021 | $1,050 | $80,770 | $12,410 | $68,360 |
| 2020 | $1,352 | $80,770 | $12,410 | $68,360 |
| 2019 | $1,394 | $80,770 | $12,410 | $68,360 |
| 2018 | $1,332 | $80,770 | $12,410 | $68,360 |
| 2017 | $1,292 | $80,250 | $9,737 | $70,513 |
| 2016 | $1,248 | $75,190 | $0 | $0 |
| 2015 | $1,248 | $79,700 | $0 | $0 |
| 2014 | $1,332 | $79,700 | $0 | $0 |
Source: Public Records
Map
Nearby Homes
Your Personal Tour Guide
Ask me questions while you tour the home.