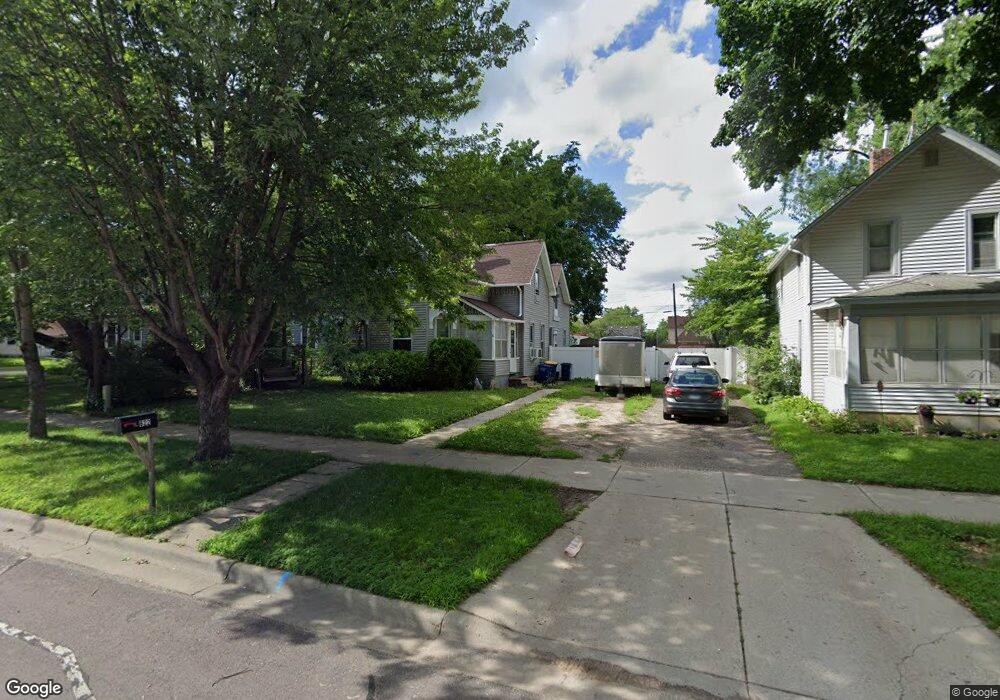
622 3rd St NW Faribault, MN 55021
Estimated Value: $216,085 - $276,000
4
Beds
2
Baths
1,856
Sq Ft
$129/Sq Ft
Est. Value
About This Home
This home is located at 622 3rd St NW, Faribault, MN 55021 and is currently estimated at $239,521, approximately $129 per square foot. 622 3rd St NW is a home located in Rice County with nearby schools including Jefferson Elementary School, Faribault Middle School, and Faribault Senior High School.
Ownership History
Date
Name
Owned For
Owner Type
Purchase Details
Closed on
Mar 14, 2011
Sold by
Fannie Mae
Bought by
Bongers Sabrina L
Current Estimated Value
Home Financials for this Owner
Home Financials are based on the most recent Mortgage that was taken out on this home.
Original Mortgage
$46,295
Outstanding Balance
$31,371
Interest Rate
4.5%
Mortgage Type
FHA
Estimated Equity
$208,150
Purchase Details
Closed on
Mar 8, 2011
Sold by
Fannie Mae
Bought by
Bongers Sabrina L
Home Financials for this Owner
Home Financials are based on the most recent Mortgage that was taken out on this home.
Original Mortgage
$46,295
Outstanding Balance
$31,371
Interest Rate
4.5%
Mortgage Type
FHA
Estimated Equity
$208,150
Purchase Details
Closed on
Feb 25, 2000
Sold by
Action Realty Of Faribault Inc
Bought by
Keilen John J and Keilen Joyce A
Purchase Details
Closed on
Dec 3, 1999
Sold by
Hud
Bought by
Action Realty Of Faribault
Create a Home Valuation Report for This Property
The Home Valuation Report is an in-depth analysis detailing your home's value as well as a comparison with similar homes in the area
Home Values in the Area
Average Home Value in this Area
Purchase History
| Date | Buyer | Sale Price | Title Company |
|---|---|---|---|
| Bongers Sabrina L | $47,500 | -- | |
| Bongers Sabrina L | $47,500 | -- | |
| Keilen John J | $89,000 | -- | |
| Action Realty Of Faribault | $63,000 | -- |
Source: Public Records
Mortgage History
| Date | Status | Borrower | Loan Amount |
|---|---|---|---|
| Open | Bongers Sabrina L | $46,295 | |
| Closed | Bongers Sabrina L | $46,295 |
Source: Public Records
Tax History
| Year | Tax Paid | Tax Assessment Tax Assessment Total Assessment is a certain percentage of the fair market value that is determined by local assessors to be the total taxable value of land and additions on the property. | Land | Improvement |
|---|---|---|---|---|
| 2025 | $2,070 | $202,100 | $56,600 | $145,500 |
| 2024 | $2,070 | $181,000 | $53,200 | $127,800 |
| 2023 | $1,908 | $181,000 | $53,200 | $127,800 |
| 2022 | $1,678 | $172,800 | $53,200 | $119,600 |
| 2021 | $1,400 | $146,800 | $42,900 | $103,900 |
| 2020 | $1,330 | $126,600 | $41,200 | $85,400 |
| 2019 | $1,200 | $123,300 | $41,200 | $82,100 |
| 2018 | $1,094 | $113,100 | $37,800 | $75,300 |
| 2017 | $930 | $103,600 | $34,300 | $69,300 |
| 2016 | $852 | $90,100 | $34,300 | $55,800 |
| 2015 | $874 | $83,300 | $27,500 | $55,800 |
| 2014 | -- | $87,500 | $34,300 | $53,200 |
Source: Public Records
Map
Nearby Homes
Your Personal Tour Guide
Ask me questions while you tour the home.