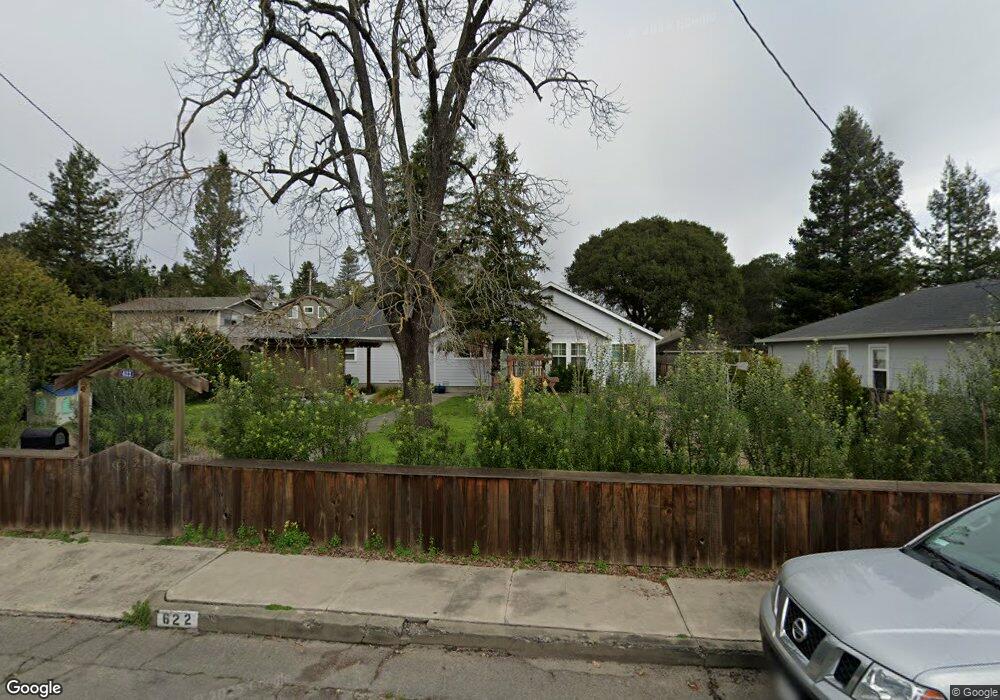
622 Baker St Petaluma, CA 94952
Western Petaluma NeighborhoodEstimated Value: $1,064,000 - $1,178,000
4
Beds
2
Baths
1,744
Sq Ft
$645/Sq Ft
Est. Value
About This Home
This home is located at 622 Baker St, Petaluma, CA 94952 and is currently estimated at $1,124,828, approximately $644 per square foot. 622 Baker St is a home located in Sonoma County with nearby schools including Valley Vista Elementary School, Petaluma Junior High School, and Petaluma High School.
Ownership History
Date
Name
Owned For
Owner Type
Purchase Details
Closed on
Sep 17, 2014
Sold by
Popielak Aaron C and Popielak Brenda J
Bought by
Berg Daniel C and Berg Sara M
Current Estimated Value
Home Financials for this Owner
Home Financials are based on the most recent Mortgage that was taken out on this home.
Original Mortgage
$552,000
Outstanding Balance
$421,967
Interest Rate
4.1%
Mortgage Type
New Conventional
Estimated Equity
$702,861
Purchase Details
Closed on
May 18, 2004
Sold by
Evans Alice Pearl and The Alice Pearl Evans Living T
Bought by
Popielak Aaron C and Popielak Brenda J
Home Financials for this Owner
Home Financials are based on the most recent Mortgage that was taken out on this home.
Original Mortgage
$400,000
Interest Rate
5%
Mortgage Type
Purchase Money Mortgage
Purchase Details
Closed on
Feb 6, 1996
Sold by
Evans Alice Pearl
Bought by
Evans Alice Pearl
Create a Home Valuation Report for This Property
The Home Valuation Report is an in-depth analysis detailing your home's value as well as a comparison with similar homes in the area
Home Values in the Area
Average Home Value in this Area
Purchase History
| Date | Buyer | Sale Price | Title Company |
|---|---|---|---|
| Berg Daniel C | $690,000 | Fidelity National Title Co | |
| Popielak Aaron C | $515,000 | Old Republic Title Company | |
| Evans Alice Pearl | -- | -- |
Source: Public Records
Mortgage History
| Date | Status | Borrower | Loan Amount |
|---|---|---|---|
| Open | Berg Daniel C | $552,000 | |
| Previous Owner | Popielak Aaron C | $400,000 |
Source: Public Records
Tax History
| Year | Tax Paid | Tax Assessment Tax Assessment Total Assessment is a certain percentage of the fair market value that is determined by local assessors to be the total taxable value of land and additions on the property. | Land | Improvement |
|---|---|---|---|---|
| 2025 | $8,870 | $829,268 | $331,707 | $497,561 |
| 2024 | $8,870 | $813,008 | $325,203 | $487,805 |
| 2023 | $8,870 | $797,068 | $318,827 | $478,241 |
| 2022 | $8,602 | $781,440 | $312,576 | $468,864 |
| 2021 | $8,439 | $766,119 | $306,448 | $459,671 |
| 2020 | $8,511 | $758,264 | $303,306 | $454,958 |
| 2019 | $8,404 | $743,397 | $297,359 | $446,038 |
| 2018 | $8,371 | $728,822 | $291,529 | $437,293 |
| 2017 | $8,194 | $714,532 | $285,813 | $428,719 |
| 2016 | $8,002 | $700,522 | $280,209 | $420,313 |
| 2015 | $7,889 | $690,000 | $276,000 | $414,000 |
| 2014 | $5,793 | $498,000 | $369,000 | $129,000 |
Source: Public Records
Map
Nearby Homes
Your Personal Tour Guide
Ask me questions while you tour the home.