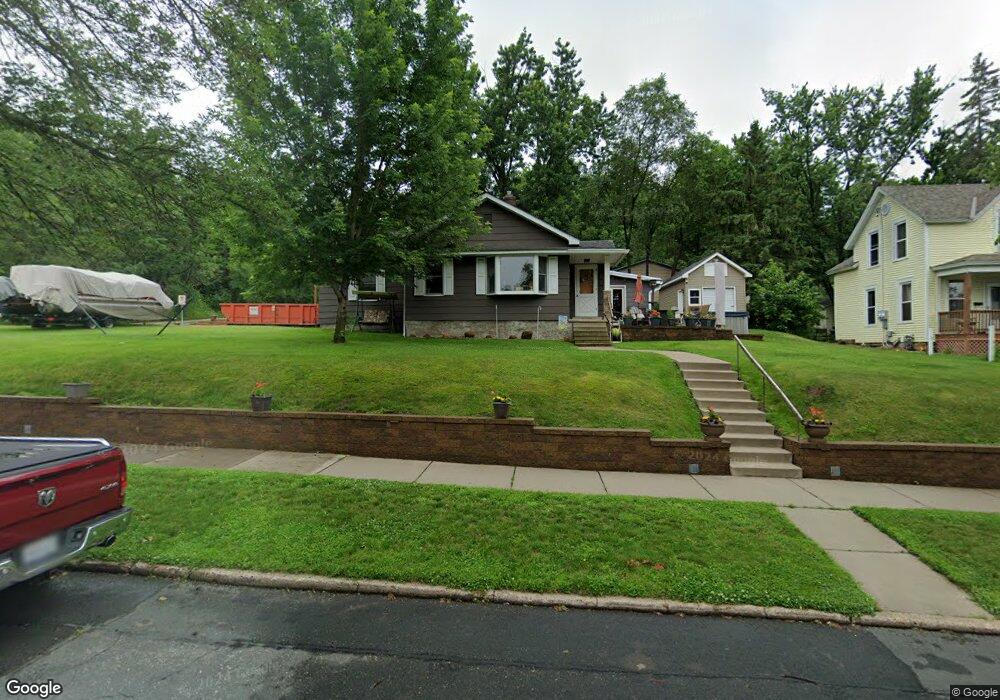
622 Locust St Hudson, WI 54016
Estimated Value: $333,000 - $399,000
4
Beds
1
Bath
1,680
Sq Ft
$213/Sq Ft
Est. Value
About This Home
This home is located at 622 Locust St, Hudson, WI 54016 and is currently estimated at $358,426, approximately $213 per square foot. 622 Locust St is a home located in St. Croix County with nearby schools including Willow River Elementary School, Hudson Middle School, and Hudson High School.
Ownership History
Date
Name
Owned For
Owner Type
Purchase Details
Closed on
May 20, 2016
Sold by
Blomquist Peter J and Blomquist Courtney J
Bought by
Johnson Dean P and Johnson Jo Marie
Current Estimated Value
Home Financials for this Owner
Home Financials are based on the most recent Mortgage that was taken out on this home.
Original Mortgage
$200,931
Outstanding Balance
$159,116
Interest Rate
3.5%
Mortgage Type
FHA
Estimated Equity
$199,310
Purchase Details
Closed on
Jul 13, 2005
Sold by
Theisen Mitchell A and Theisen Amy K
Bought by
Blomquist Peter J and Blomquist Courtney J
Home Financials for this Owner
Home Financials are based on the most recent Mortgage that was taken out on this home.
Original Mortgage
$184,500
Interest Rate
5.68%
Mortgage Type
New Conventional
Create a Home Valuation Report for This Property
The Home Valuation Report is an in-depth analysis detailing your home's value as well as a comparison with similar homes in the area
Home Values in the Area
Average Home Value in this Area
Purchase History
| Date | Buyer | Sale Price | Title Company |
|---|---|---|---|
| Johnson Dean P | $204,700 | None Available | |
| Blomquist Peter J | $185,000 | Four Seasons Title |
Source: Public Records
Mortgage History
| Date | Status | Borrower | Loan Amount |
|---|---|---|---|
| Open | Johnson Dean P | $200,931 | |
| Previous Owner | Blomquist Peter J | $184,500 |
Source: Public Records
Tax History Compared to Growth
Tax History
| Year | Tax Paid | Tax Assessment Tax Assessment Total Assessment is a certain percentage of the fair market value that is determined by local assessors to be the total taxable value of land and additions on the property. | Land | Improvement |
|---|---|---|---|---|
| 2024 | $39 | $234,400 | $67,600 | $166,800 |
| 2023 | $3,571 | $225,300 | $67,600 | $157,700 |
| 2022 | $3,319 | $225,300 | $67,600 | $157,700 |
| 2021 | $3,417 | $225,300 | $67,600 | $157,700 |
| 2020 | $3,477 | $225,300 | $67,600 | $157,700 |
| 2019 | $3,229 | $176,800 | $51,200 | $125,600 |
| 2018 | $3,223 | $173,900 | $51,200 | $122,700 |
| 2017 | $2,741 | $173,900 | $51,200 | $122,700 |
| 2016 | $2,741 | $156,500 | $51,200 | $105,300 |
| 2015 | $2,572 | $156,500 | $51,200 | $105,300 |
| 2014 | $2,523 | $156,500 | $51,200 | $105,300 |
| 2013 | $2,617 | $156,500 | $51,200 | $105,300 |
Source: Public Records
Map
Nearby Homes
- 706 Orange St
- 685 Darnold Dr
- 674 Darnold Dr
- 715 4th St
- 738 9th St
- 114 Buckeye St
- 22 1st St Unit 301
- 1031 2nd St
- 1302 4th St
- 621 Mallalieu Dr
- 1302 2nd St
- 19 Birkmose Park Ln
- 1603 Hunter Hill Rd
- 705 Evergreen Cir
- 907 Coulee Rd Unit 105
- 834 Summer Pines Cir
- 834 Evergreen Cir
- 1625 Summer St
- 1803 Willow Dr
- 1211 Birch Dr