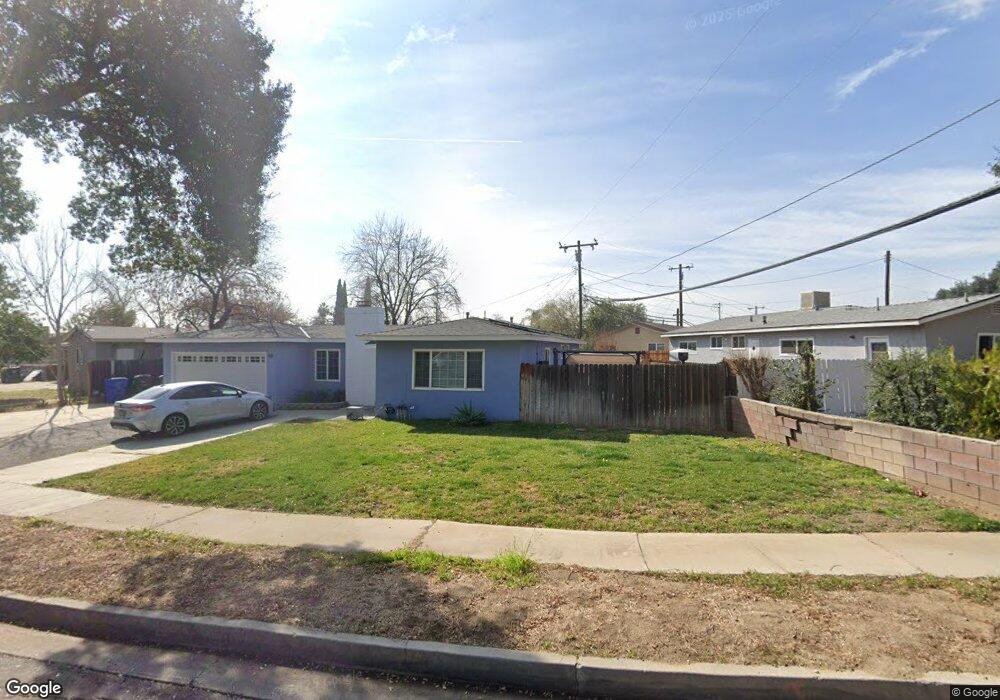
622 N Macy St San Bernardino, CA 92410
Terrace NeighborhoodEstimated Value: $498,000 - $687,000
3
Beds
2
Baths
1,494
Sq Ft
$383/Sq Ft
Est. Value
About This Home
This home is located at 622 N Macy St, San Bernardino, CA 92410 and is currently estimated at $572,579, approximately $383 per square foot. 622 N Macy St is a home located in San Bernardino County with nearby schools including Myers Elementary School, Frisbie Middle School, and Eisenhower High School.
Ownership History
Date
Name
Owned For
Owner Type
Purchase Details
Closed on
Apr 14, 2003
Sold by
Brown Gerald L and Brown Teresa A
Bought by
Camey Elizabeth
Current Estimated Value
Home Financials for this Owner
Home Financials are based on the most recent Mortgage that was taken out on this home.
Original Mortgage
$144,000
Interest Rate
5.75%
Mortgage Type
Purchase Money Mortgage
Create a Home Valuation Report for This Property
The Home Valuation Report is an in-depth analysis detailing your home's value as well as a comparison with similar homes in the area
Home Values in the Area
Average Home Value in this Area
Purchase History
| Date | Buyer | Sale Price | Title Company |
|---|---|---|---|
| Camey Elizabeth | $180,000 | Stewart Title Company |
Source: Public Records
Mortgage History
| Date | Status | Borrower | Loan Amount |
|---|---|---|---|
| Previous Owner | Camey Elizabeth | $144,000 | |
| Closed | Camey Elizabeth | $36,000 |
Source: Public Records
Tax History Compared to Growth
Tax History
| Year | Tax Paid | Tax Assessment Tax Assessment Total Assessment is a certain percentage of the fair market value that is determined by local assessors to be the total taxable value of land and additions on the property. | Land | Improvement |
|---|---|---|---|---|
| 2025 | $3,322 | $260,701 | $65,175 | $195,526 |
| 2024 | $3,322 | $255,589 | $63,897 | $191,692 |
| 2023 | $3,326 | $250,577 | $62,644 | $187,933 |
| 2022 | $3,277 | $245,664 | $61,416 | $184,248 |
| 2021 | $3,335 | $240,847 | $60,212 | $180,635 |
| 2020 | $3,344 | $238,378 | $59,595 | $178,783 |
| 2019 | $3,259 | $233,703 | $58,426 | $175,277 |
| 2018 | $3,209 | $229,120 | $57,280 | $171,840 |
| 2017 | $3,099 | $224,628 | $56,157 | $168,471 |
| 2016 | $3,168 | $220,224 | $55,056 | $165,168 |
| 2015 | $2,925 | $216,916 | $54,229 | $162,687 |
| 2014 | $2,647 | $199,000 | $60,000 | $139,000 |
Source: Public Records
Map
Nearby Homes
- 2286 Kyla Ct
- 2280 Kyla Ct
- 2289 Kyla Ct
- 2279 W 7th St
- 2271 W 7th St
- 2455 Saint Elmo Dr
- 0 Foothill Blvd Unit BB25030028
- 2495 Etiwanda Ave
- 820 San Carlo Ave
- 2247 W Court St
- 857 N Dallas Ave
- 559 N Marvin Dr
- 556 N Marvin Dr
- 2505 Foothill Blvd Unit 230
- 2505 W E Foothill Blvd Unit 231
- 1010 Terrace Rd Unit 52
- 1010 Terrace Rd Unit 38
- 1010 Terrace Rd Unit 177
- 1010 Terrace Rd
- 1010 Terrace Rd Unit 19