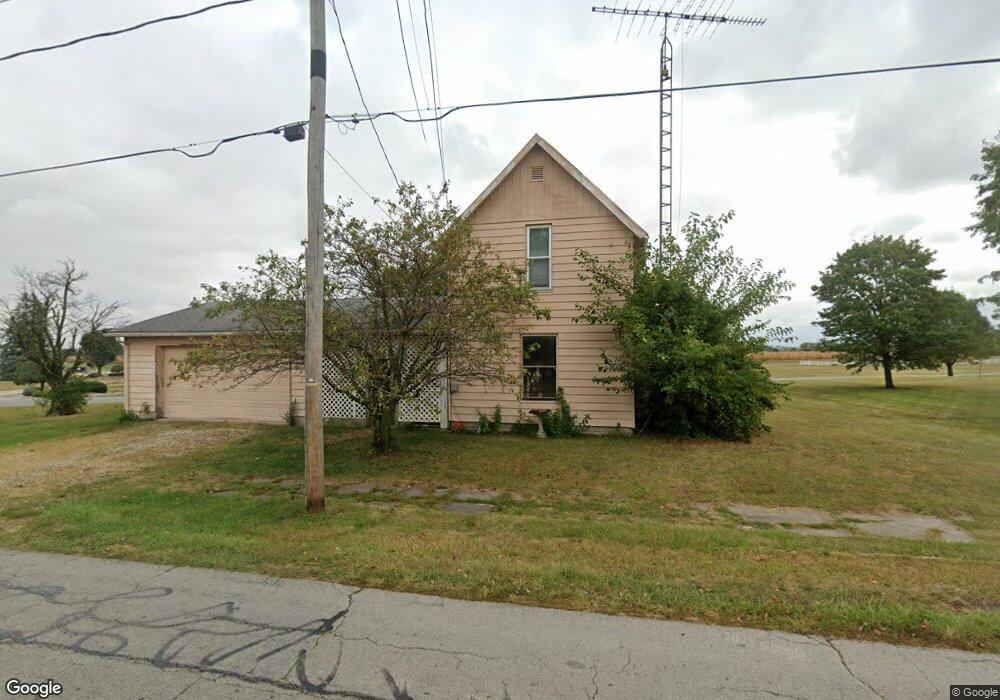
622 N State Line St Union City, OH 45390
Estimated Value: $79,000 - $151,000
3
Beds
1
Bath
1,208
Sq Ft
$87/Sq Ft
Est. Value
About This Home
This home is located at 622 N State Line St, Union City, OH 45390 and is currently estimated at $105,520, approximately $87 per square foot. 622 N State Line St is a home located in Darke County with nearby schools including Mississinawa Valley Elementary School and Mississinawa Valley Junior/Senior High School.
Ownership History
Date
Name
Owned For
Owner Type
Purchase Details
Closed on
Oct 14, 2013
Sold by
Lemaster John and Lemaster Kathy L
Bought by
Lemaster Rentals Llc
Current Estimated Value
Purchase Details
Closed on
Jun 23, 2012
Sold by
The Bank Of New York Mellon
Bought by
Lemaster John L
Purchase Details
Closed on
Mar 6, 2012
Sold by
Helmer Randy J and Helmer Randy K
Bought by
The Bank Of New York Mellon and The Bank Of New York
Purchase Details
Closed on
Dec 17, 2006
Sold by
Price Clarabel K
Bought by
Helmer Randy J
Home Financials for this Owner
Home Financials are based on the most recent Mortgage that was taken out on this home.
Original Mortgage
$50,065
Interest Rate
10.68%
Mortgage Type
Purchase Money Mortgage
Purchase Details
Closed on
Feb 4, 1992
Bought by
Lemaster Rentals Llc An Ohio Limited Lia
Purchase Details
Closed on
Nov 1, 1987
Bought by
Lemaster Rentals Llc An Ohio Limited Lia
Create a Home Valuation Report for This Property
The Home Valuation Report is an in-depth analysis detailing your home's value as well as a comparison with similar homes in the area
Home Values in the Area
Average Home Value in this Area
Purchase History
| Date | Buyer | Sale Price | Title Company |
|---|---|---|---|
| Lemaster Rentals Llc | -- | Attorney | |
| Lemaster John L | $8,000 | Servicelink | |
| The Bank Of New York Mellon | $16,667 | None Available | |
| Helmer Randy J | $52,700 | Attorney | |
| Lemaster Rentals Llc An Ohio Limited Lia | $31,000 | -- | |
| Lemaster Rentals Llc An Ohio Limited Lia | $17,500 | -- |
Source: Public Records
Mortgage History
| Date | Status | Borrower | Loan Amount |
|---|---|---|---|
| Previous Owner | Helmer Randy J | $50,065 |
Source: Public Records
Tax History Compared to Growth
Tax History
| Year | Tax Paid | Tax Assessment Tax Assessment Total Assessment is a certain percentage of the fair market value that is determined by local assessors to be the total taxable value of land and additions on the property. | Land | Improvement |
|---|---|---|---|---|
| 2024 | $639 | $19,240 | $2,160 | $17,080 |
| 2023 | $640 | $19,240 | $2,160 | $17,080 |
| 2022 | $519 | $13,060 | $1,840 | $11,220 |
| 2021 | $528 | $13,060 | $1,840 | $11,220 |
| 2020 | $530 | $13,060 | $1,840 | $11,220 |
| 2019 | $436 | $11,120 | $1,840 | $9,280 |
| 2018 | $430 | $11,120 | $1,840 | $9,280 |
| 2017 | $406 | $11,120 | $1,840 | $9,280 |
| 2016 | $407 | $11,130 | $2,480 | $8,650 |
| 2015 | $451 | $12,360 | $2,480 | $9,880 |
| 2014 | $453 | $12,360 | $2,480 | $9,880 |
| 2013 | $468 | $12,360 | $2,480 | $9,880 |
Source: Public Records
Map
Nearby Homes
- 207 Allen Dr
- 543 N Walnut St
- 722 N Union St
- 0 W Deerfield Rd Unit 23016117
- 0 W Deerfield Rd Unit 837795
- 0 W Deerfield Rd
- 504 N Union St
- 504 N Union St Unit Street
- 612 N Howard St
- 113 E North St
- 305 E North St
- 230 NW Deerfield Rd
- 706 Lynwood Ct
- 507 N Howard St
- 718 Lynwood Ct
- 509 Indiana 28
- 508 N High St
- 1013 Caroline Ave
- 227 South St
- 720 E Main St
- 620 N State Line St
- 102 Pleasant Dr
- 626 N State Line St
- 106 Pleasant Dr
- 110 Pleasant Dr
- 112 Pleasant Dr
- 119 Heritage Ln Unit F119
- 116 Allen Dr
- 109 Pleasant Dr
- 120 Allen Dr Unit F120
- 121 Heritage Ln Unit F121
- 107 Pleasant Dr
- 114 Pleasant Dr
- 122 Allen Dr Unit F122
- 826 N State Line Rd
- 111 Pleasant Dr
- 121 Allen Dr
- 116 Pleasant Dr
- 123 Allen Dr Unit D123
- 840 N Union St