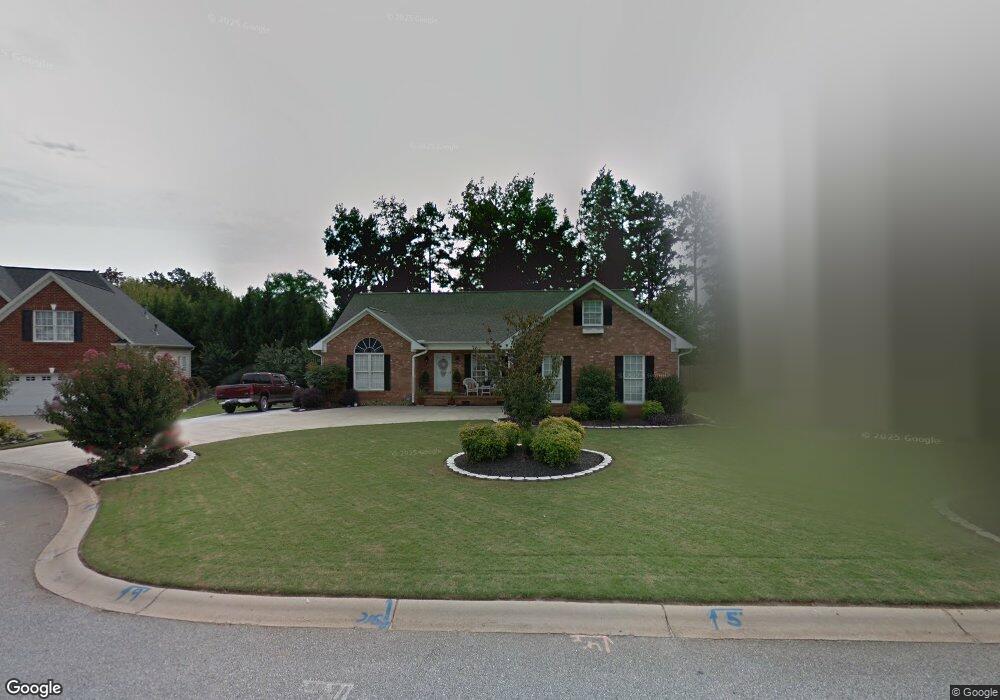
622 Tillman Ct Roebuck, SC 29376
Estimated Value: $349,012 - $370,000
3
Beds
3
Baths
2,601
Sq Ft
$138/Sq Ft
Est. Value
About This Home
This home is located at 622 Tillman Ct, Roebuck, SC 29376 and is currently estimated at $359,253, approximately $138 per square foot. 622 Tillman Ct is a home located in Spartanburg County with nearby schools including Dorman High School Freshman Campus, Dorman High School, and Eddlemon Adventist School.
Ownership History
Date
Name
Owned For
Owner Type
Purchase Details
Closed on
Aug 29, 2014
Sold by
Bishop Jeremy J and Bishop Elizabeth P
Bought by
Chynoweth Leigh A and Chynoweth Dennis
Current Estimated Value
Home Financials for this Owner
Home Financials are based on the most recent Mortgage that was taken out on this home.
Original Mortgage
$193,877
Outstanding Balance
$148,272
Interest Rate
4.19%
Mortgage Type
Future Advance Clause Open End Mortgage
Estimated Equity
$210,981
Purchase Details
Closed on
Mar 13, 2008
Sold by
Dailey Bobby D and Dailey Tammy R
Bought by
Bishop Jeremy J and Bishop Elizabeth P
Home Financials for this Owner
Home Financials are based on the most recent Mortgage that was taken out on this home.
Original Mortgage
$188,955
Interest Rate
5.68%
Mortgage Type
Purchase Money Mortgage
Purchase Details
Closed on
Jul 19, 2002
Sold by
B J Ivey & Son Inc
Bought by
Dailey Bobby D and Dailey Tammy R
Create a Home Valuation Report for This Property
The Home Valuation Report is an in-depth analysis detailing your home's value as well as a comparison with similar homes in the area
Home Values in the Area
Average Home Value in this Area
Purchase History
| Date | Buyer | Sale Price | Title Company |
|---|---|---|---|
| Chynoweth Leigh A | $195,000 | -- | |
| Bishop Jeremy J | $198,900 | None Available | |
| Dailey Bobby D | $178,500 | -- |
Source: Public Records
Mortgage History
| Date | Status | Borrower | Loan Amount |
|---|---|---|---|
| Open | Chynoweth Leigh A | $193,877 | |
| Previous Owner | Bishop Jeremy J | $188,955 |
Source: Public Records
Tax History Compared to Growth
Tax History
| Year | Tax Paid | Tax Assessment Tax Assessment Total Assessment is a certain percentage of the fair market value that is determined by local assessors to be the total taxable value of land and additions on the property. | Land | Improvement |
|---|---|---|---|---|
| 2025 | $1,888 | $10,046 | $940 | $9,106 |
| 2024 | $1,888 | $10,046 | $940 | $9,106 |
| 2023 | $1,888 | $10,046 | $940 | $9,106 |
| 2022 | $1,700 | $8,736 | $917 | $7,819 |
| 2021 | $1,680 | $8,736 | $917 | $7,819 |
| 2020 | $1,642 | $8,736 | $917 | $7,819 |
| 2019 | $1,585 | $8,660 | $1,000 | $7,660 |
| 2018 | $1,591 | $8,660 | $1,000 | $7,660 |
| 2017 | $1,384 | $7,596 | $1,000 | $6,596 |
| 2016 | $1,416 | $7,596 | $1,000 | $6,596 |
| 2015 | $1,447 | $7,936 | $1,000 | $6,936 |
| 2014 | $1,315 | $7,432 | $1,000 | $6,432 |
Source: Public Records
Map
Nearby Homes
- 313 New Windsor Ct
- 2013 Hillman Way
- 2011 Hillman Way
- 2009 Hillman Way
- Ashford Plan at Trenton Place
- 919 Equine Dr
- 506 Rose Trellis Ct
- 436 Rambling Rose Way
- Edinburg Plan at Highland Park
- Cypress Plan at Highland Park
- Arlington Plan at Highland Park
- 6003 Haddington Dr
- 524 Semillon Ln
- 58 Arbours Ln W
- 203 Basswood Dr
- 427 Listrac Dr
- 442 Listrac Dr
- 140 Eastbrook Terrace
- 618 Tillman Ct
- 626 Tillman Ct
- 735 Herndon Terrace
- 739 Herndon Terrace
- 614 Tillman Ct
- 731 Herndon Terrace
- 619 Tillman Ct
- 627 Tillman Ct
- 623 Tillman Ct
- 615 Tillman Ct
- 743 Herndon Terrace
- 727 Herndon Terrace
- 610 Tillman Ct
- 611 Tillman Ct
- 518 Saint Helena Ct
- 522 Saint Helena Ct
- 514 Saint Helena Ct
- 734 Herndon Terrace
- 723 Herndon Terrace
- 738 Herndon Terrace