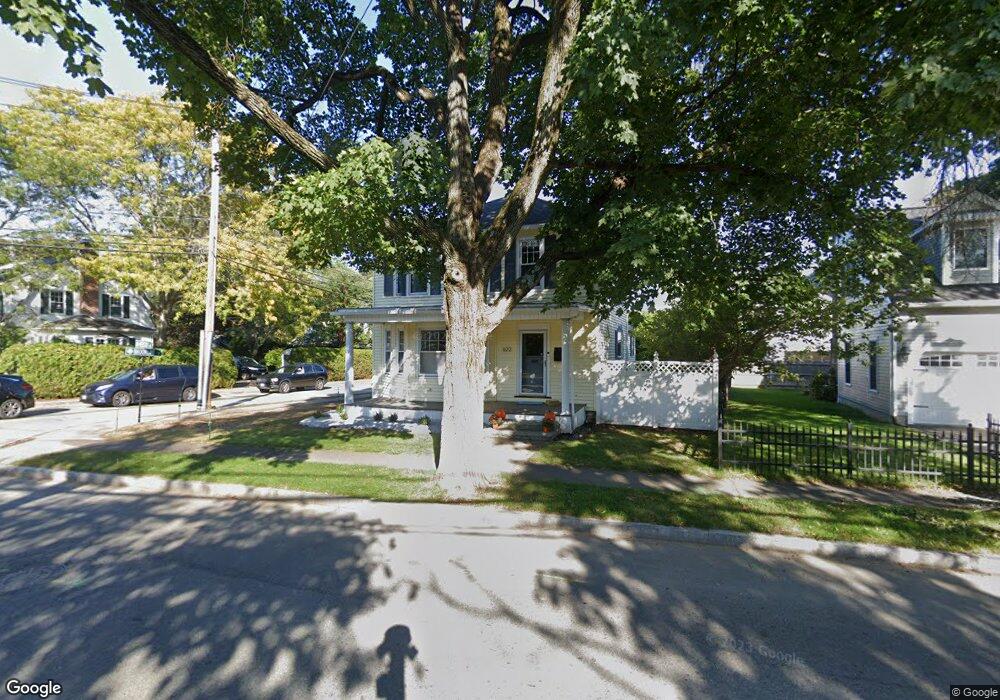
622 Webster St Needham, MA 02492
Estimated Value: $1,152,997 - $1,268,000
3
Beds
1
Bath
1,382
Sq Ft
$891/Sq Ft
Est. Value
About This Home
This home is located at 622 Webster St, Needham, MA 02492 and is currently estimated at $1,231,499, approximately $891 per square foot. 622 Webster St is a home located in Norfolk County with nearby schools including Mitchell Elementary School, High Rock Middle School, and Pollard Middle School.
Ownership History
Date
Name
Owned For
Owner Type
Purchase Details
Closed on
Aug 11, 2022
Sold by
Zaval Jessica J and Zaval Peter F
Bought by
Mcgrath Kyle M and Mcgrath Jane B
Current Estimated Value
Home Financials for this Owner
Home Financials are based on the most recent Mortgage that was taken out on this home.
Original Mortgage
$736,000
Outstanding Balance
$702,848
Interest Rate
5.7%
Mortgage Type
Purchase Money Mortgage
Estimated Equity
$528,651
Purchase Details
Closed on
Jan 27, 2012
Sold by
Allenby Daniel and Allenby Sarah
Bought by
Zaval Jessica J and Zaval Peter F
Home Financials for this Owner
Home Financials are based on the most recent Mortgage that was taken out on this home.
Original Mortgage
$467,832
Interest Rate
3.94%
Mortgage Type
New Conventional
Purchase Details
Closed on
May 17, 2004
Sold by
Petipas Judith B and Petipas Richard B
Bought by
Allenby Daniel and Allenby Sarah
Home Financials for this Owner
Home Financials are based on the most recent Mortgage that was taken out on this home.
Original Mortgage
$350,080
Interest Rate
5.47%
Mortgage Type
Purchase Money Mortgage
Create a Home Valuation Report for This Property
The Home Valuation Report is an in-depth analysis detailing your home's value as well as a comparison with similar homes in the area
Home Values in the Area
Average Home Value in this Area
Purchase History
| Date | Buyer | Sale Price | Title Company |
|---|---|---|---|
| Mcgrath Kyle M | $920,000 | None Available | |
| Zaval Jessica J | $480,000 | -- | |
| Allenby Daniel | $437,600 | -- | |
| Allenby Daniel | $437,600 | -- |
Source: Public Records
Mortgage History
| Date | Status | Borrower | Loan Amount |
|---|---|---|---|
| Open | Mcgrath Kyle M | $736,000 | |
| Previous Owner | Allenby Daniel | $467,832 | |
| Previous Owner | Allenby Daniel | $350,080 | |
| Previous Owner | Allenby Daniel | $65,640 |
Source: Public Records
Tax History Compared to Growth
Tax History
| Year | Tax Paid | Tax Assessment Tax Assessment Total Assessment is a certain percentage of the fair market value that is determined by local assessors to be the total taxable value of land and additions on the property. | Land | Improvement |
|---|---|---|---|---|
| 2025 | $10,287 | $970,500 | $572,400 | $398,100 |
| 2024 | $11,099 | $886,500 | $481,600 | $404,900 |
| 2023 | $8,638 | $662,400 | $401,300 | $261,100 |
| 2022 | $8,320 | $622,300 | $371,600 | $250,700 |
| 2021 | $8,109 | $622,300 | $371,600 | $250,700 |
| 2020 | $8,117 | $649,900 | $373,400 | $276,500 |
| 2019 | $7,072 | $570,800 | $339,400 | $231,400 |
| 2018 | $6,781 | $570,800 | $339,400 | $231,400 |
| 2017 | $5,700 | $479,400 | $339,400 | $140,000 |
| 2016 | $5,550 | $480,900 | $339,400 | $141,500 |
| 2015 | $5,429 | $480,900 | $339,400 | $141,500 |
| 2014 | $5,501 | $472,600 | $334,500 | $138,100 |
Source: Public Records
Map
Nearby Homes
- 556 Webster St
- 40 Otis St Unit L
- 42 Otis St Unit R
- 190 Brookline St
- 62 Washington Ave
- 445 Hillside Ave
- 154 Warren St
- 332 Hillcrest Rd
- 26 Pinewood Rd
- 3 Crescent Rd
- 71 School St
- 233 Warren St
- 400 Hunnewell St Unit 103
- 379 Hunnewell St Unit 379
- 34 Pershing Rd
- 23 Cheney St
- 9 Jayne Rd
- 78 Birds Hill Ave
- 36 Davenport Rd
- 143 Hunting Rd
- 622 Webster St
- 628 Webster St
- 614 Webster St
- 354 Brookline St
- 608 Webster St
- 349 Brookline St
- 634 Webster St
- 346 Brookline St
- 345 Brookline St
- 604 Webster St
- 642 Webster St
- 338 Brookline St
- 338 Brookline St
- 338 Brookline St
- 338 Brookline St Unit 1
- 638 Webster St
- 638 Webster St Unit 638
- 14 Fairlawn St
- 20 Holland Terrace
- 598 Webster St