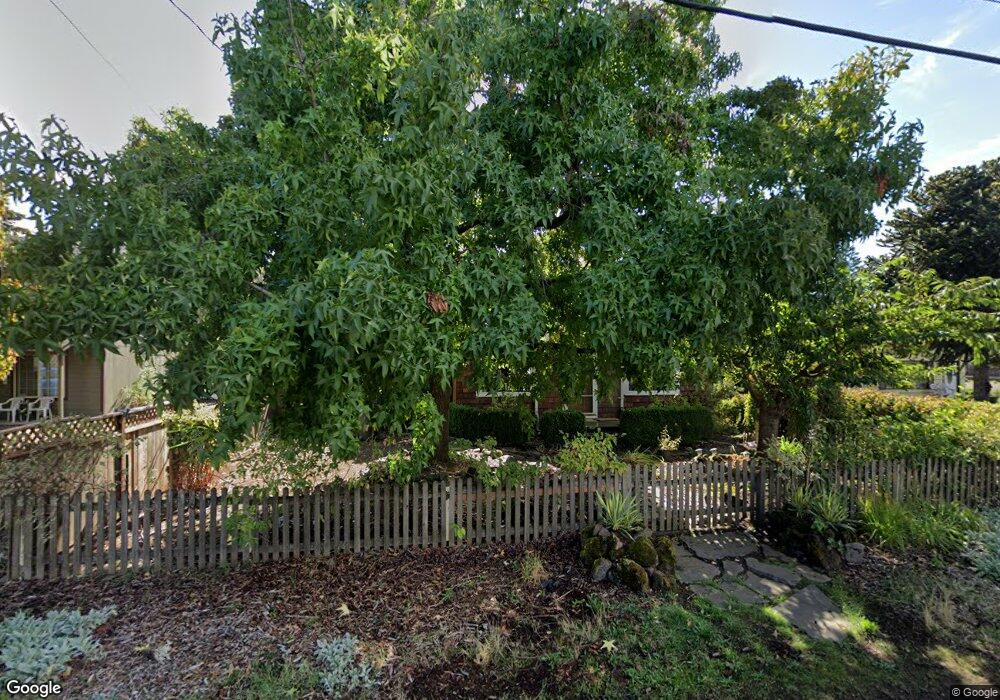
6220 SE Clatsop St Portland, OR 97206
Southgate NeighborhoodEstimated Value: $342,000 - $486,000
3
Beds
1
Bath
1,554
Sq Ft
$268/Sq Ft
Est. Value
About This Home
This home is located at 6220 SE Clatsop St, Portland, OR 97206 and is currently estimated at $415,917, approximately $267 per square foot. 6220 SE Clatsop St is a home located in Clackamas County with nearby schools including Ardenwald Elementary School, Rowe Middle School, and Milwaukie High School.
Ownership History
Date
Name
Owned For
Owner Type
Purchase Details
Closed on
Nov 4, 1998
Sold by
Sovey Kenneth W and Meshorer Neil Douglas
Bought by
Lucier Michelle B
Current Estimated Value
Home Financials for this Owner
Home Financials are based on the most recent Mortgage that was taken out on this home.
Original Mortgage
$139,721
Outstanding Balance
$30,551
Interest Rate
6.61%
Mortgage Type
FHA
Estimated Equity
$385,366
Purchase Details
Closed on
Jun 1, 1995
Sold by
Packard Mary Ruth and Packard Mary Ruth Roscoe
Bought by
Sovey Kenneth W and Meshorer Neil Douglas
Home Financials for this Owner
Home Financials are based on the most recent Mortgage that was taken out on this home.
Original Mortgage
$103,000
Interest Rate
8.32%
Purchase Details
Closed on
May 30, 1995
Sold by
Packard James W and Packard Mary Ruth
Bought by
Packard James W and Packard Mary Ruth
Home Financials for this Owner
Home Financials are based on the most recent Mortgage that was taken out on this home.
Original Mortgage
$103,000
Interest Rate
8.32%
Create a Home Valuation Report for This Property
The Home Valuation Report is an in-depth analysis detailing your home's value as well as a comparison with similar homes in the area
Home Values in the Area
Average Home Value in this Area
Purchase History
| Date | Buyer | Sale Price | Title Company |
|---|---|---|---|
| Lucier Michelle B | $142,000 | Chicago Title Insurance Co | |
| Sovey Kenneth W | $108,500 | Fidelity National Title Co | |
| Packard James W | -- | Fidelity National Title |
Source: Public Records
Mortgage History
| Date | Status | Borrower | Loan Amount |
|---|---|---|---|
| Open | Lucier Michelle B | $139,721 | |
| Previous Owner | Sovey Kenneth W | $103,000 |
Source: Public Records
Tax History Compared to Growth
Tax History
| Year | Tax Paid | Tax Assessment Tax Assessment Total Assessment is a certain percentage of the fair market value that is determined by local assessors to be the total taxable value of land and additions on the property. | Land | Improvement |
|---|---|---|---|---|
| 2024 | $2,678 | $143,001 | -- | -- |
| 2023 | $2,678 | $138,836 | $0 | $0 |
| 2022 | $2,461 | $134,793 | $0 | $0 |
| 2021 | $2,370 | $130,867 | $0 | $0 |
| 2020 | $2,294 | $127,056 | $0 | $0 |
| 2019 | $2,261 | $123,356 | $0 | $0 |
| 2018 | $1,976 | $119,763 | $0 | $0 |
| 2017 | $1,911 | $116,275 | $0 | $0 |
| 2016 | $1,842 | $112,888 | $0 | $0 |
| 2015 | $1,789 | $109,600 | $0 | $0 |
| 2014 | $1,691 | $106,408 | $0 | $0 |
Source: Public Records
Map
Nearby Homes
- 6412 SE Clatsop St
- 6136 SE Harney St
- 6505 SE Clatsop St Unit C
- 6108 SE Tenino St
- 8710 SE 57th Ave
- 8940 SE Stanley Place
- 8425 SE 57th Ave
- 9301 SE Wichita Ave
- 6139 SE Nehalem St
- 5903 SE Nehalem St
- 6071 SE Lexington St
- 6047 SE Lexington St
- 7035 SE Alberta St
- 6923 SE Nehalem St
- 5808 SE Laurel St
- 7125 SE Fern Ave
- 5319 SE Harney Dr
- 9306 SE 55th Ave
- 5903 SE Malden St
- 7189 SE Crystal Springs Blvd Unit 10
- 6200 SE Clatsop St
- 6228 SE Clatsop St
- 6232 SE Clatsop St
- 6244 SE Clatsop St
- 8704 SE 62nd Ave
- 6304 SE Clatsop St
- 6211 SE Clatsop St
- 6223 SE Clatsop St
- 6235 SE Clatsop St
- 6318 SE Clatsop St
- 8532 SE 62nd Ave
- 8532 SE 62nd Ave Unit A-B
- 6205 SE Hazel Ave
- 6203 SE Hazel Ave
- 6215 SE Hazel Ave
- 6305 SE Clatsop St
- 6110 SE Clatsop St
- 6320 SE Clatsop St
- 6221 SE Hazel Ave
- 8533 SE 63rd Ave