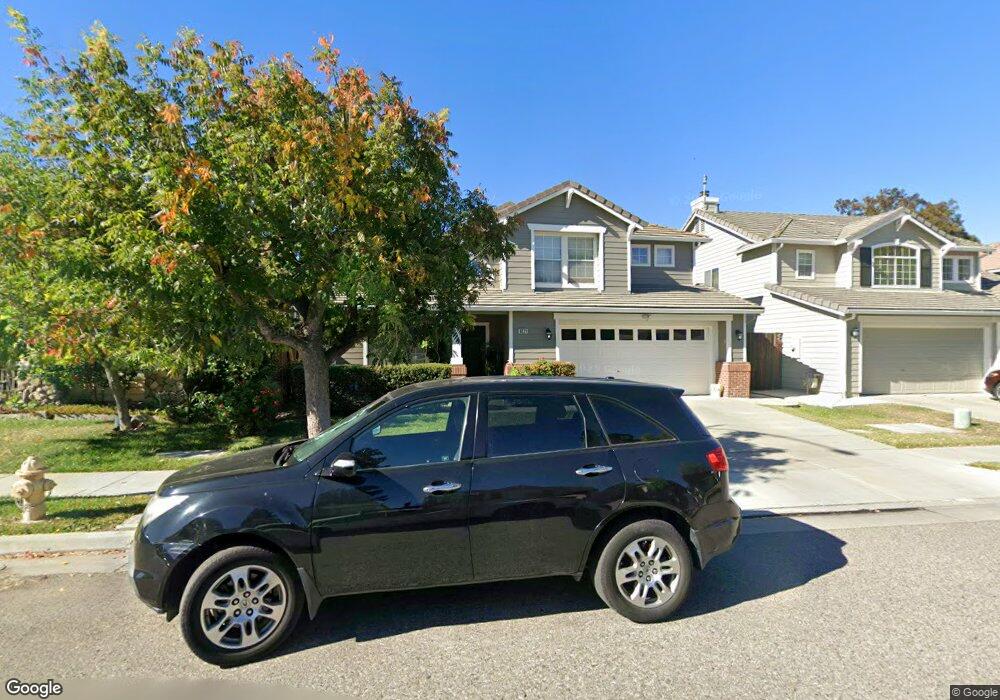
6221 Ginashell Cir San Jose, CA 95119
Rancho Santa Teresa NeighborhoodEstimated Value: $1,424,012 - $1,546,000
3
Beds
3
Baths
1,497
Sq Ft
$993/Sq Ft
Est. Value
About This Home
This home is located at 6221 Ginashell Cir, San Jose, CA 95119 and is currently estimated at $1,486,003, approximately $992 per square foot. 6221 Ginashell Cir is a home located in Santa Clara County with nearby schools including Santa Teresa Elementary School, Bernal Intermediate School, and Santa Teresa High School.
Ownership History
Date
Name
Owned For
Owner Type
Purchase Details
Closed on
Jun 3, 2004
Sold by
Wallsom Elizabeth and Wallsom David
Bought by
Pham Nhu Q and Pham Michele
Current Estimated Value
Home Financials for this Owner
Home Financials are based on the most recent Mortgage that was taken out on this home.
Original Mortgage
$350,000
Outstanding Balance
$143,963
Interest Rate
3.67%
Mortgage Type
Negative Amortization
Estimated Equity
$1,342,040
Purchase Details
Closed on
Nov 16, 2001
Sold by
Wallsom Elizabeth and Wallsom David
Bought by
Wallsom David and Wallsom Elizabeth
Home Financials for this Owner
Home Financials are based on the most recent Mortgage that was taken out on this home.
Original Mortgage
$275,000
Interest Rate
6.57%
Purchase Details
Closed on
Sep 24, 1996
Sold by
Kaufman & Broad South Bay Inc
Bought by
Wallsom David and Wallsom Elizabeth Rose
Home Financials for this Owner
Home Financials are based on the most recent Mortgage that was taken out on this home.
Original Mortgage
$251,050
Interest Rate
7.87%
Create a Home Valuation Report for This Property
The Home Valuation Report is an in-depth analysis detailing your home's value as well as a comparison with similar homes in the area
Home Values in the Area
Average Home Value in this Area
Purchase History
| Date | Buyer | Sale Price | Title Company |
|---|---|---|---|
| Pham Nhu Q | $642,000 | Alliance Title Company | |
| Wallsom David | -- | Financial Title Company | |
| Wallsom David | $287,500 | First American Title Guarant |
Source: Public Records
Mortgage History
| Date | Status | Borrower | Loan Amount |
|---|---|---|---|
| Open | Pham Nhu Q | $350,000 | |
| Previous Owner | Wallsom David | $275,000 | |
| Previous Owner | Wallsom David | $251,050 |
Source: Public Records
Tax History
| Year | Tax Paid | Tax Assessment Tax Assessment Total Assessment is a certain percentage of the fair market value that is determined by local assessors to be the total taxable value of land and additions on the property. | Land | Improvement |
|---|---|---|---|---|
| 2025 | $12,656 | $912,769 | $362,547 | $550,222 |
| 2024 | $12,656 | $894,873 | $355,439 | $539,434 |
| 2023 | $12,464 | $877,327 | $348,470 | $528,857 |
| 2022 | $12,384 | $860,126 | $341,638 | $518,488 |
| 2021 | $12,210 | $843,262 | $334,940 | $508,322 |
| 2020 | $11,950 | $834,616 | $331,506 | $503,110 |
| 2019 | $11,675 | $818,252 | $325,006 | $493,246 |
| 2018 | $11,597 | $802,209 | $318,634 | $483,575 |
| 2017 | $11,441 | $786,481 | $312,387 | $474,094 |
| 2016 | $10,888 | $771,061 | $306,262 | $464,799 |
| 2015 | $10,608 | $749,000 | $297,500 | $451,500 |
| 2014 | $8,602 | $645,000 | $256,200 | $388,800 |
Source: Public Records
Map
Nearby Homes
- 6121 Lambeck Ln Unit 972
- 890 White Moonstone Loop
- 5951 Sunstone Dr Unit 208
- 815 Blue Opal Dr
- 6060 Charlotte Dr
- 6147 Camino Verde Dr Unit A
- 5925 Charlotte Dr Unit 212
- 6063 Raleigh Rd
- 5886 Smoky Quartz Loop
- 5965 Woodspring Loop
- 5740 Vibrant Loop
- 6575 Kaneko Dr
- 5948 Sage Dr
- 313 Oakberry Way
- 5968 Virtual Ct
- 6075 Bigelow Ct
- 6816 Vector Ct
- 332 Oakberry Way
- 6694 Optimum Loop
- 6702 Optimum Loop
- 6217 Ginashell Cir
- 6225 Ginashell Cir
- 6116 Yeadon Way
- 6120 Yeadon Way
- 6112 Yeadon Way
- 6213 Ginashell Cir
- 6229 Ginashell Cir
- 6124 Yeadon Way
- 6108 Yeadon Way
- 6220 Ginashell Cir
- 6224 Ginashell Cir
- 6216 Ginashell Cir
- 6209 Ginashell Cir
- 6233 Ginashell Cir
- 6128 Yeadon Way
- 6104 Yeadon Way
- 6212 Ginashell Cir
- 6237 Ginashell Cir
- 6205 Ginashell Cir
- 6208 Ginashell Cir