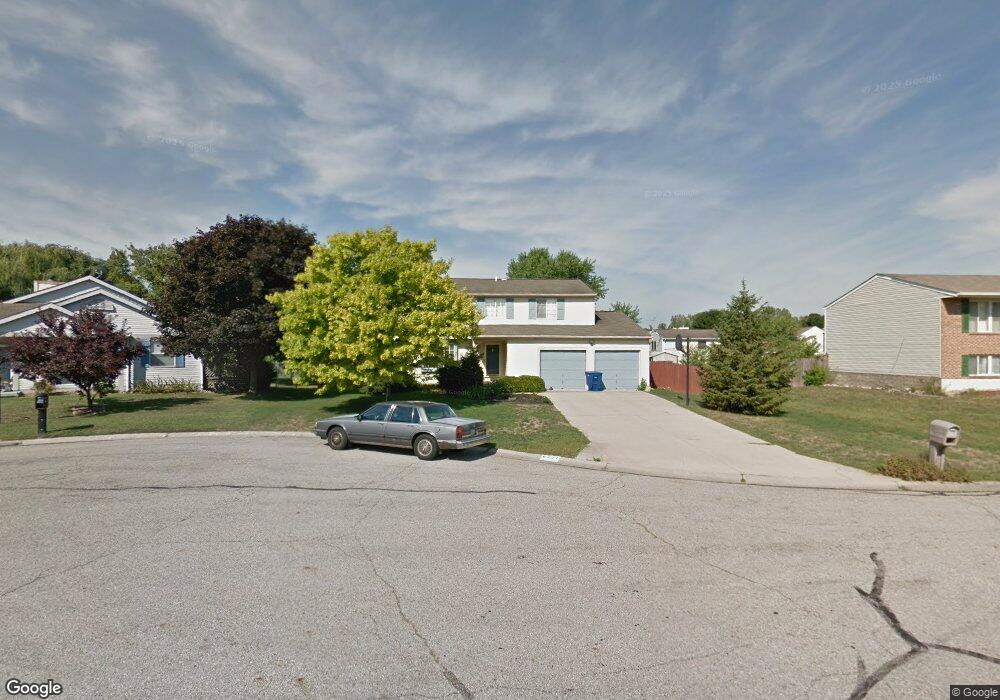
6221 Raspberry Ct Clayton, OH 45315
Estimated Value: $232,445 - $272,000
4
Beds
2
Baths
1,704
Sq Ft
$150/Sq Ft
Est. Value
About This Home
This home is located at 6221 Raspberry Ct, Clayton, OH 45315 and is currently estimated at $255,361, approximately $149 per square foot. 6221 Raspberry Ct is a home located in Montgomery County with nearby schools including Northmoor Elementary School, Northmont High School, and Trotwood Preparatory & Fitness Academy.
Ownership History
Date
Name
Owned For
Owner Type
Purchase Details
Closed on
Mar 18, 2014
Sold by
Ward Jay E and Ward Roxanne
Bought by
Ward Jay E and Ward Roxanne
Current Estimated Value
Home Financials for this Owner
Home Financials are based on the most recent Mortgage that was taken out on this home.
Original Mortgage
$108,298
Outstanding Balance
$81,359
Interest Rate
4.34%
Mortgage Type
VA
Estimated Equity
$174,002
Purchase Details
Closed on
Jul 27, 1999
Sold by
Gadway Jeffrey G and Gadway Lori A
Bought by
Ward Jay E
Home Financials for this Owner
Home Financials are based on the most recent Mortgage that was taken out on this home.
Original Mortgage
$121,540
Interest Rate
7.87%
Mortgage Type
VA
Purchase Details
Closed on
Mar 27, 1997
Sold by
Chaplin Lance M and Chaplin Tracy L
Bought by
Gadway Jeffrey G and Gadway Lori A
Create a Home Valuation Report for This Property
The Home Valuation Report is an in-depth analysis detailing your home's value as well as a comparison with similar homes in the area
Home Values in the Area
Average Home Value in this Area
Purchase History
| Date | Buyer | Sale Price | Title Company |
|---|---|---|---|
| Ward Jay E | -- | None Available | |
| Ward Jay E | $118,000 | -- | |
| Gadway Jeffrey G | $109,000 | -- |
Source: Public Records
Mortgage History
| Date | Status | Borrower | Loan Amount |
|---|---|---|---|
| Open | Ward Jay E | $108,298 | |
| Closed | Ward Jay E | $121,540 |
Source: Public Records
Tax History
| Year | Tax Paid | Tax Assessment Tax Assessment Total Assessment is a certain percentage of the fair market value that is determined by local assessors to be the total taxable value of land and additions on the property. | Land | Improvement |
|---|---|---|---|---|
| 2025 | $3,869 | $64,890 | $14,830 | $50,060 |
| 2024 | $3,750 | $64,890 | $14,830 | $50,060 |
| 2023 | $3,750 | $64,890 | $14,830 | $50,060 |
| 2022 | $3,007 | $39,810 | $9,100 | $30,710 |
| 2021 | $3,016 | $39,810 | $9,100 | $30,710 |
| 2020 | $3,014 | $39,810 | $9,100 | $30,710 |
| 2019 | $2,880 | $34,250 | $9,100 | $25,150 |
| 2018 | $2,887 | $34,250 | $9,100 | $25,150 |
| 2017 | $2,868 | $34,250 | $9,100 | $25,150 |
| 2016 | $2,890 | $33,790 | $9,100 | $24,690 |
| 2015 | $2,656 | $33,790 | $9,100 | $24,690 |
| 2014 | $2,656 | $33,790 | $9,100 | $24,690 |
| 2012 | -- | $39,610 | $10,010 | $29,600 |
Source: Public Records
Map
Nearby Homes
- 6269 Fall Gold Dr
- 6325 Burkwood Dr
- 5025 Willow Rd
- 1018 Redwood Rd
- 1003 Redwood Rd
- 4002 Summit Ct
- 6425 Woodacre Ct
- 5097 Crescent Ridge Dr Unit 95097
- 4734 Rushwood Cir
- 5172 Seville Dr
- 6042 Cinnamon Tree Ct
- 5071 Seville Dr
- 6612 Westgrove Dr
- 6065 Layne Hills Ct
- 4761 Old Salem Rd
- 6473 Waywind Dr
- 5482 Union Rd
- 7132 Cierra Dr
- 6459 Waywind Dr
- 0 Breckenridge Trail Unit 1044258
- 6211 Raspberry Ct
- 6231 Raspberry Ct
- 5852 Coralberry Dr
- 5864 Coralberry Dr
- 6200 Raspberry Ct
- 5927 Summersweet Dr
- 5917 Summersweet Dr
- 6220 Raspberry Ct
- 5907 Summersweet Dr
- 6230 Raspberry Ct
- 6210 Raspberry Ct
- 5876 Coralberry Dr
- 5841 Coralberry Dr
- 5897 Summersweet Dr
- 5851 Coralberry Dr
- 5831 Coralberry Dr
- 5861 Coralberry Dr
- 5891 Summersweet Dr
- 5947 Summersweet Dr
- 5821 Coralberry Dr
Your Personal Tour Guide
Ask me questions while you tour the home.