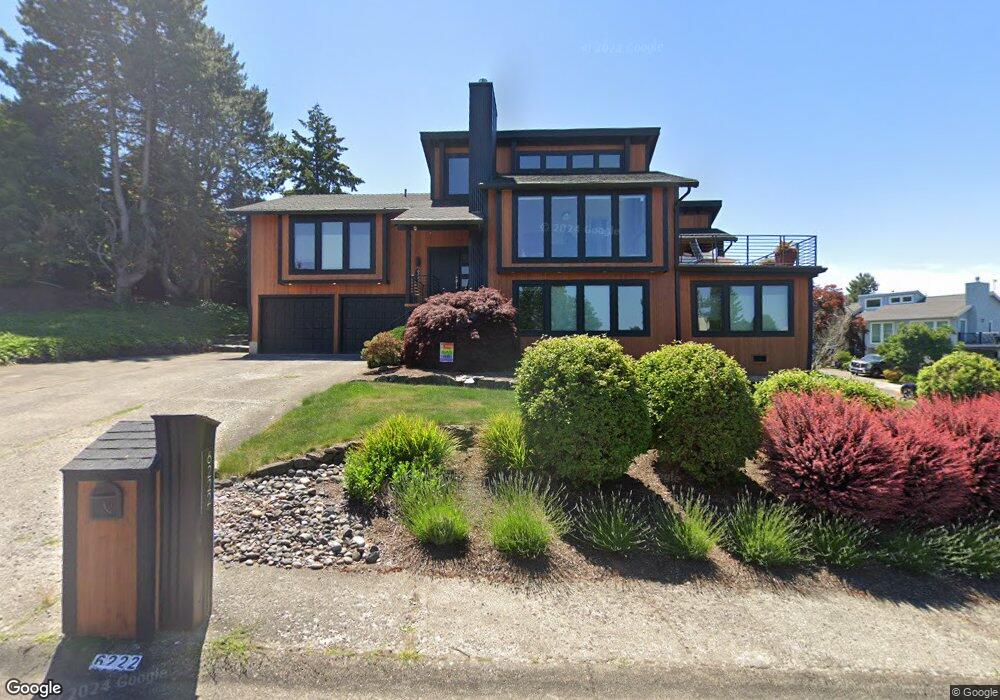
6222 Tack Ct West Linn, OR 97068
Hidden Springs NeighborhoodEstimated Value: $900,348 - $973,000
4
Beds
3
Baths
2,576
Sq Ft
$365/Sq Ft
Est. Value
About This Home
This home is located at 6222 Tack Ct, West Linn, OR 97068 and is currently estimated at $940,587, approximately $365 per square foot. 6222 Tack Ct is a home located in Clackamas County with nearby schools including Trillium Creek Primary School, Rosemont Ridge Middle School, and West Linn High School.
Ownership History
Date
Name
Owned For
Owner Type
Purchase Details
Closed on
Jul 12, 2023
Sold by
Atkinson Kathryn J
Bought by
Atkinson Kathryn and Schwarzer Thomas
Current Estimated Value
Purchase Details
Closed on
May 21, 2009
Sold by
Mcgaff George and Mcgaff Karen
Bought by
Atkinson Kathryn J
Home Financials for this Owner
Home Financials are based on the most recent Mortgage that was taken out on this home.
Original Mortgage
$46,800
Interest Rate
4.82%
Mortgage Type
Credit Line Revolving
Purchase Details
Closed on
Jun 26, 2006
Sold by
Eden Leigh D and Eden Barbara J
Bought by
Mcgaff George and Mcgaff Karen
Home Financials for this Owner
Home Financials are based on the most recent Mortgage that was taken out on this home.
Original Mortgage
$100,000
Interest Rate
6.18%
Mortgage Type
Credit Line Revolving
Create a Home Valuation Report for This Property
The Home Valuation Report is an in-depth analysis detailing your home's value as well as a comparison with similar homes in the area
Home Values in the Area
Average Home Value in this Area
Purchase History
| Date | Buyer | Sale Price | Title Company |
|---|---|---|---|
| Atkinson Kathryn | -- | None Listed On Document | |
| Atkinson Kathryn J | $468,000 | Fidelity Natl Title Co Of Or | |
| Mcgaff George | $467,000 | Fidelity Natl Title Co Of Or |
Source: Public Records
Mortgage History
| Date | Status | Borrower | Loan Amount |
|---|---|---|---|
| Previous Owner | Atkinson Kathryn J | $46,800 | |
| Previous Owner | Atkinson Kathryn J | $370,200 | |
| Previous Owner | Mcgaff George | $100,000 | |
| Previous Owner | Mcgaff George | $343,600 |
Source: Public Records
Tax History Compared to Growth
Tax History
| Year | Tax Paid | Tax Assessment Tax Assessment Total Assessment is a certain percentage of the fair market value that is determined by local assessors to be the total taxable value of land and additions on the property. | Land | Improvement |
|---|---|---|---|---|
| 2025 | $10,014 | $519,647 | -- | -- |
| 2024 | $9,640 | $504,512 | -- | -- |
| 2023 | $9,640 | $489,818 | $0 | $0 |
| 2022 | $9,099 | $475,552 | $0 | $0 |
| 2021 | $8,637 | $461,701 | $0 | $0 |
| 2020 | $8,566 | $448,254 | $0 | $0 |
| 2019 | $7,797 | $414,015 | $0 | $0 |
| 2018 | $10,159 | $386,524 | $0 | $0 |
| 2017 | $6,394 | $344,622 | $0 | $0 |
| 2016 | $6,129 | $334,584 | $0 | $0 |
| 2015 | $5,829 | $324,839 | $0 | $0 |
| 2014 | $5,497 | $315,378 | $0 | $0 |
Source: Public Records
Map
Nearby Homes
- 2024 Conestoga Ln
- 6275 Clubhouse Cir
- 6135 Cheyenne Terrace
- 6233 Meridian Cir
- 2038 Titan Terrace
- 20111 Hoodview Ave
- 2583 Pimlico Dr
- 19874 Bennington Ct
- 20322 Noble Ln
- 4057 Heron Dr
- 20349 Noble Ln
- 19788 Wildwood Dr
- 21065 Apollo Ct
- 20120 Larkspur Ln Unit 85
- 3710 Mohawk Way
- 2005 Carriage Way
- 19770 Wildwood Dr
- 4050 Serango Ct
- 20030 Marigold Ct Unit 15
- 22987 Bland Cir
- 2155 Bridle Way
- 6214 Tack Ct
- 2190 Bridle Way
- 6251 Tack Ct
- 2113 Bridle Way
- 6233 Tack Ct
- 2178 Bridle Way
- 6263 Tack Ct
- 6211 Tack Ct
- 2156 Bridle Way
- 6221 Tack Ct
- 2132 Bridle Way
- 6271 Tack Ct
- 2105 Bridle Way
- 6280 Tack Ct
- 2018 Conestoga Ln
- 2181 Club House Dr
- 2112 Bridle Way
- 2020 Conestoga Ln
- 2171 Club House Dr