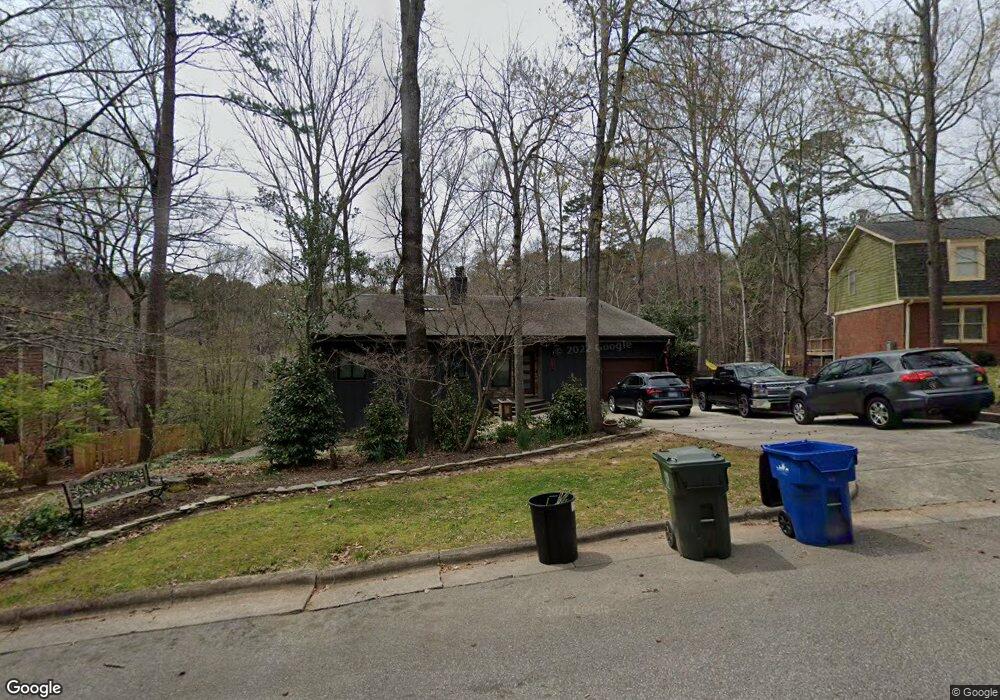
6223 Lookout Loop Raleigh, NC 27612
Estimated Value: $516,000 - $595,000
3
Beds
3
Baths
2,366
Sq Ft
$235/Sq Ft
Est. Value
About This Home
This home is located at 6223 Lookout Loop, Raleigh, NC 27612 and is currently estimated at $556,055, approximately $235 per square foot. 6223 Lookout Loop is a home located in Wake County with nearby schools including Lynn Road Elementary School, Carroll Middle, and Sanderson High School.
Ownership History
Date
Name
Owned For
Owner Type
Purchase Details
Closed on
Mar 31, 2014
Sold by
Dade James T and Porter Richard C
Bought by
Nabewaniec Adam J and Nabewaniec Kathryn S
Current Estimated Value
Home Financials for this Owner
Home Financials are based on the most recent Mortgage that was taken out on this home.
Original Mortgage
$247,500
Outstanding Balance
$187,862
Interest Rate
4.3%
Mortgage Type
New Conventional
Estimated Equity
$368,193
Purchase Details
Closed on
Feb 16, 2012
Sold by
Dade James T
Bought by
Dade James T and Porter Richard C
Home Financials for this Owner
Home Financials are based on the most recent Mortgage that was taken out on this home.
Original Mortgage
$216,000
Interest Rate
3.92%
Mortgage Type
New Conventional
Create a Home Valuation Report for This Property
The Home Valuation Report is an in-depth analysis detailing your home's value as well as a comparison with similar homes in the area
Home Values in the Area
Average Home Value in this Area
Purchase History
| Date | Buyer | Sale Price | Title Company |
|---|---|---|---|
| Nabewaniec Adam J | $280,000 | None Available | |
| Dade James T | -- | None Available | |
| Dade James T | $270,000 | None Available |
Source: Public Records
Mortgage History
| Date | Status | Borrower | Loan Amount |
|---|---|---|---|
| Open | Nabewaniec Adam J | $247,500 | |
| Previous Owner | Dade James T | $216,000 |
Source: Public Records
Tax History Compared to Growth
Tax History
| Year | Tax Paid | Tax Assessment Tax Assessment Total Assessment is a certain percentage of the fair market value that is determined by local assessors to be the total taxable value of land and additions on the property. | Land | Improvement |
|---|---|---|---|---|
| 2025 | $4,509 | $514,705 | $230,000 | $284,705 |
| 2024 | $4,490 | $514,705 | $230,000 | $284,705 |
| 2023 | $3,674 | $335,252 | $110,000 | $225,252 |
| 2022 | $3,414 | $335,252 | $110,000 | $225,252 |
| 2021 | $3,262 | $333,198 | $110,000 | $223,198 |
| 2020 | $3,203 | $333,198 | $110,000 | $223,198 |
| 2019 | $3,332 | $285,819 | $95,000 | $190,819 |
| 2018 | $3,082 | $280,255 | $95,000 | $185,255 |
| 2017 | $2,935 | $280,255 | $95,000 | $185,255 |
| 2016 | $2,893 | $281,990 | $95,000 | $186,990 |
| 2015 | $2,841 | $272,431 | $95,000 | $177,431 |
| 2014 | $2,695 | $272,431 | $95,000 | $177,431 |
Source: Public Records
Map
Nearby Homes
- 6221 Rushingbrook Dr
- 6409 Lakeland Dr
- 1337 Springlawn Ct
- 1325 Springlawn Ct
- 1375 Garden Crest Cir
- 1302 Springlawn Ct
- 6404 Dixon Dr
- 1901 Longwood Dr
- 5444 Pine Top Cir
- 1500 Prisma Ct
- 813 Mill Greens Ct
- 5613 Ashton Dr
- 5804 Heatherbrook Cir
- 5716 N Hills Dr
- 6313 Ashley Ridge Dr
- 5418 Ridgeloch Place
- 1500 Shadowood Ln
- 6202 Dixon Dr
- 1104 Hickory Pond Ct
- 5309 Ridgeloch Place
- 6225 Lookout Loop
- 6221 Lookout Loop
- 6227 Lookout Loop
- 6224 Lookout Loop
- 6219 Lookout Loop
- 6228 Lookout Loop
- 6220 Lookout Loop
- 6229 Lookout Loop
- 6217 Lookout Loop
- 6232 Lookout Loop
- 6216 Lookout Loop
- 6231 Lookout Loop
- 6215 Lookout Loop
- 6204 Lakerun Ct
- 6236 Lookout Loop
- 6212 Lookout Loop
- 6200 Lakerun Ct
- 6233 Lookout Loop
- 6213 Lookout Loop
- 6208 Lookout Loop