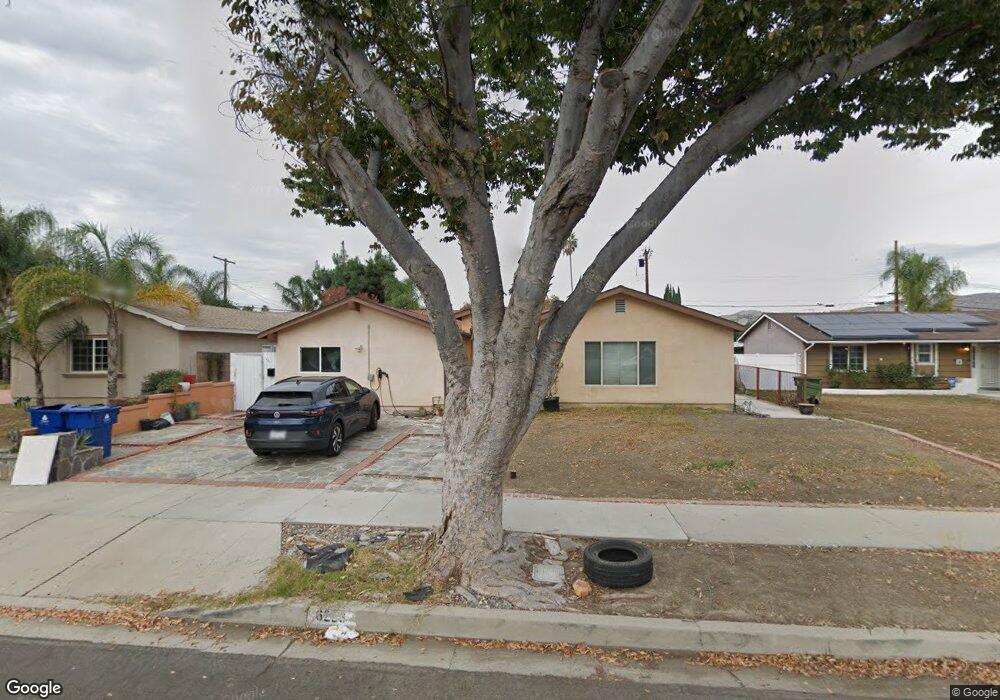
6223 Platt Ave Woodland Hills, CA 91367
Estimated Value: $1,089,000 - $1,190,000
4
Beds
3
Baths
1,650
Sq Ft
$691/Sq Ft
Est. Value
About This Home
This home is located at 6223 Platt Ave, Woodland Hills, CA 91367 and is currently estimated at $1,139,465, approximately $690 per square foot. 6223 Platt Ave is a home located in Los Angeles County with nearby schools including Lockhurst Drive Charter Elementary, Haynes Charter For Enriched Studies, and Woodlake Elementary Community Charter.
Ownership History
Date
Name
Owned For
Owner Type
Purchase Details
Closed on
Feb 22, 2013
Sold by
Hilel Ofer
Bought by
Hilel Shoshy
Current Estimated Value
Purchase Details
Closed on
Feb 21, 2013
Sold by
Salman Jay and Garcia Nancy
Bought by
Hilel Shoshy
Purchase Details
Closed on
Nov 26, 1996
Sold by
Federal National Mortgage Association
Bought by
Salman Jay and Garcia Nancy
Home Financials for this Owner
Home Financials are based on the most recent Mortgage that was taken out on this home.
Original Mortgage
$135,700
Interest Rate
7.67%
Mortgage Type
Seller Take Back
Purchase Details
Closed on
Jun 13, 1996
Sold by
Aguilera Eduardo and Federal National Mortgage Asso
Bought by
Federal National Mortgage Association
Create a Home Valuation Report for This Property
The Home Valuation Report is an in-depth analysis detailing your home's value as well as a comparison with similar homes in the area
Home Values in the Area
Average Home Value in this Area
Purchase History
| Date | Buyer | Sale Price | Title Company |
|---|---|---|---|
| Hilel Shoshy | -- | Chicago Title Company | |
| Hilel Shoshy | $380,000 | Chicago Title Company | |
| Salman Jay | $140,000 | American Title Ins Co | |
| Federal National Mortgage Association | $143,000 | Stewart Title |
Source: Public Records
Mortgage History
| Date | Status | Borrower | Loan Amount |
|---|---|---|---|
| Previous Owner | Salman Jay | $135,700 |
Source: Public Records
Tax History Compared to Growth
Tax History
| Year | Tax Paid | Tax Assessment Tax Assessment Total Assessment is a certain percentage of the fair market value that is determined by local assessors to be the total taxable value of land and additions on the property. | Land | Improvement |
|---|---|---|---|---|
| 2025 | $7,514 | $598,250 | $337,159 | $261,091 |
| 2024 | $7,514 | $586,521 | $330,549 | $255,972 |
| 2023 | $7,375 | $575,021 | $324,068 | $250,953 |
| 2022 | $7,042 | $563,747 | $317,714 | $246,033 |
| 2021 | $6,951 | $552,694 | $311,485 | $241,209 |
| 2019 | $6,239 | $496,073 | $302,248 | $193,825 |
| 2018 | $6,076 | $486,347 | $296,322 | $190,025 |
| 2017 | $5,038 | $403,193 | $290,512 | $112,681 |
| 2016 | $4,922 | $395,288 | $284,816 | $110,472 |
| 2015 | $4,852 | $389,351 | $280,538 | $108,813 |
| 2014 | $4,875 | $381,725 | $275,043 | $106,682 |
Source: Public Records
Map
Nearby Homes
- 6236 Kenwater Ave
- 6172 Dalecrest Ave
- 23812 Calvert St
- 6416 Kenwater Place
- 23549 Victory Blvd Unit 21
- 6227 Glide Ave
- 23432 Victory Blvd
- 6153 Debs Ave
- 6001 Manton Ave
- 24017 Sylvan St
- 5929 Adler Ave
- 6022 Elba Place
- 6670 Platt Ave
- 24208 Gilmore St
- 24244 Friar St
- 23928 Archwood St
- 6020 Neddy Ave
- 6544 Sheltondale Ave
- 23238 Victory Blvd
- 6009 Neddy Ave
- 6215 Platt Ave
- 6229 Platt Ave
- 6235 Platt Ave
- 6209 Platt Ave
- 6218 Kenwater Ave
- 6224 Kenwater Ave
- 6212 Kenwater Ave
- 6230 Kenwater Ave
- 6245 Platt Ave
- 6243 Platt Ave
- 6201 Platt Ave
- 6206 Kenwater Ave
- 6200 Kenwater Ave
- 6249 Platt Ave
- 6242 Kenwater Ave
- 6176 Kenwater Ave
- 6221 Kenwater Ave
- 6227 Kenwater Ave
- 6213 Kenwater Ave
- 6218 Platt Ave