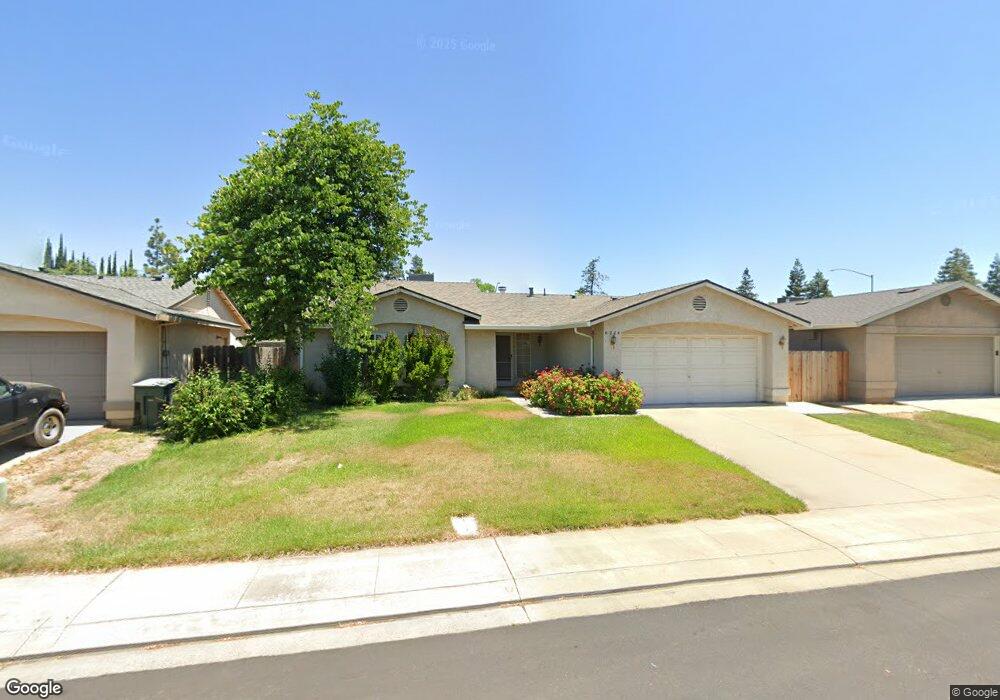
6224 High Mesa Way Riverbank, CA 95367
Estimated Value: $308,000 - $470,000
4
Beds
2
Baths
1,351
Sq Ft
$308/Sq Ft
Est. Value
About This Home
This home is located at 6224 High Mesa Way, Riverbank, CA 95367 and is currently estimated at $416,195, approximately $308 per square foot. 6224 High Mesa Way is a home located in Stanislaus County with nearby schools including Stanislaus Elementary School, Prescott Junior High School, and Fred C. Beyer High School.
Ownership History
Date
Name
Owned For
Owner Type
Purchase Details
Closed on
Nov 17, 2016
Sold by
Lozano Nancy and Lozano Nancy Jane
Bought by
Lozano Nancy
Current Estimated Value
Home Financials for this Owner
Home Financials are based on the most recent Mortgage that was taken out on this home.
Original Mortgage
$111,000
Interest Rate
3.47%
Mortgage Type
New Conventional
Purchase Details
Closed on
Sep 16, 2014
Sold by
Lozano Nancy Jane
Bought by
Lozano Nancy Jane
Home Financials for this Owner
Home Financials are based on the most recent Mortgage that was taken out on this home.
Original Mortgage
$110,750
Interest Rate
4.09%
Mortgage Type
New Conventional
Purchase Details
Closed on
May 10, 2001
Sold by
Lozano Jeffery and Lozano Nancy Jane
Bought by
Lozano Nancy Jane
Home Financials for this Owner
Home Financials are based on the most recent Mortgage that was taken out on this home.
Original Mortgage
$128,000
Interest Rate
7.03%
Create a Home Valuation Report for This Property
The Home Valuation Report is an in-depth analysis detailing your home's value as well as a comparison with similar homes in the area
Purchase History
| Date | Buyer | Sale Price | Title Company |
|---|---|---|---|
| Lozano Nancy | -- | Old Republic Title Company | |
| Lozano Nancy Jane | -- | Service Link | |
| Lozano Nancy Jane | -- | Chicago Title Co |
Source: Public Records
Mortgage History
| Date | Status | Borrower | Loan Amount |
|---|---|---|---|
| Closed | Lozano Nancy | $111,000 | |
| Closed | Lozano Nancy Jane | $110,750 | |
| Closed | Lozano Nancy Jane | $128,000 |
Source: Public Records
Tax History
| Year | Tax Paid | Tax Assessment Tax Assessment Total Assessment is a certain percentage of the fair market value that is determined by local assessors to be the total taxable value of land and additions on the property. | Land | Improvement |
|---|---|---|---|---|
| 2025 | $2,676 | $218,225 | $75,743 | $142,482 |
| 2024 | $2,622 | $213,947 | $74,258 | $139,689 |
| 2023 | $2,568 | $209,752 | $72,802 | $136,950 |
| 2022 | $2,466 | $205,640 | $71,375 | $134,265 |
| 2021 | $2,418 | $201,609 | $69,976 | $131,633 |
| 2020 | $2,377 | $199,543 | $69,259 | $130,284 |
| 2019 | $2,329 | $195,631 | $67,901 | $127,730 |
| 2018 | $2,279 | $191,796 | $66,570 | $125,226 |
| 2017 | $2,222 | $188,036 | $65,265 | $122,771 |
| 2016 | $2,201 | $184,350 | $63,986 | $120,364 |
| 2015 | $2,172 | $181,582 | $63,025 | $118,557 |
| 2014 | $2,124 | $174,500 | $40,000 | $134,500 |
Source: Public Records
Map
Nearby Homes
- 6054 Kasper Dr
- 2107 Patterson Rd Unit 31
- 6613 Cypresswood Cir
- 2325 Rio Verde Dr
- 2137 Candlewood Place
- 6236 Jaguar Ct
- 5713 Antique Rose Way
- 6625 River Mesa Dr
- 2255 Patterson Rd
- 2302 Bungalow Ct
- 2500 Novi Dr
- 2667 Patterson Rd
- 2260 Gallery Dr
- 2644 Morrill Rd
- 5530 Chancellor Way
- 5901 Newbrook Dr Unit 78
- 2035 Shoreline Dr
- 2039 Shoreline Dr
- 5446 Harvest Creek Dr
- 5412 Harmony Cir
- 6230 High Mesa Way
- 6218 High Mesa Way
- 6236 High Mesa Way
- 6212 High Mesa Way
- 2142 Laredo Ln
- 2143 Silverock Rd
- 6242 High Mesa Way
- 2136 Laredo Ln
- 6219 Colony Park Dr
- 2143 Laredo Ln
- 6213 Colony Park Dr
- 6225 Colony Park Dr
- 2137 Silverock Rd
- 6207 Colony Park Dr
- 6248 High Mesa Way
- 6231 Colony Park Dr
- 2137 Laredo Ln
- 2130 Laredo Ln
- 6201 Colony Park Dr
- 2160 Silverock Rd
Your Personal Tour Guide
Ask me questions while you tour the home.