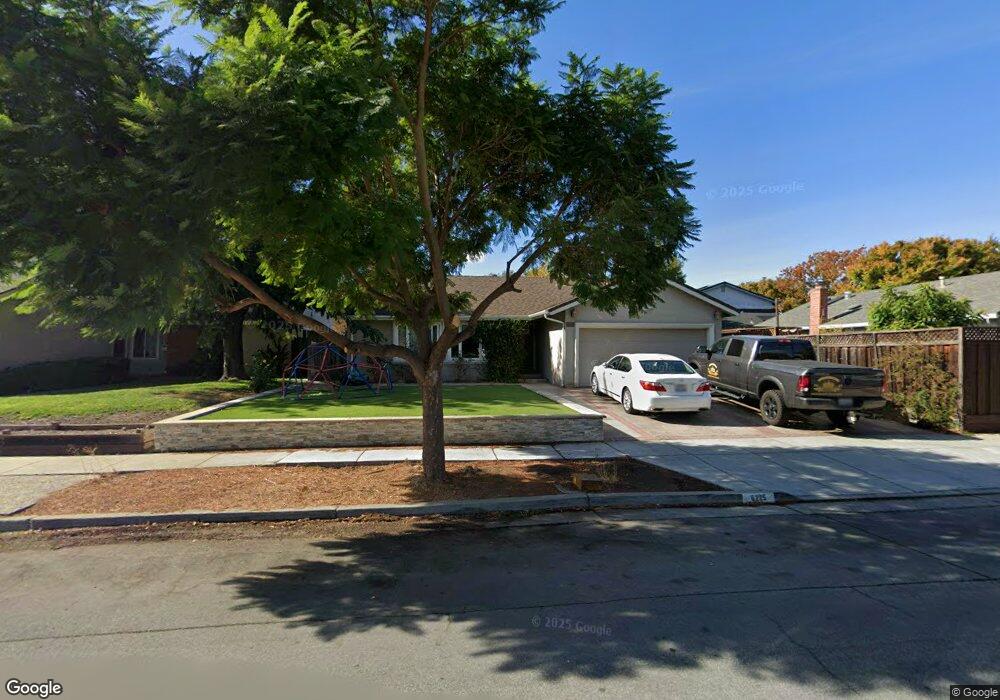
6225 Bothell Cir San Jose, CA 95123
Santa Teresa Foothills NeighborhoodEstimated Value: $1,257,203 - $1,485,000
3
Beds
2
Baths
1,143
Sq Ft
$1,175/Sq Ft
Est. Value
About This Home
This home is located at 6225 Bothell Cir, San Jose, CA 95123 and is currently estimated at $1,343,551, approximately $1,175 per square foot. 6225 Bothell Cir is a home located in Santa Clara County with nearby schools including Bertha Taylor Elementary School, Bernal Intermediate School, and Santa Teresa High School.
Ownership History
Date
Name
Owned For
Owner Type
Purchase Details
Closed on
Aug 7, 2003
Sold by
Hall David F and Hall Katerine F
Bought by
Hall David F and Hall Katherine F
Current Estimated Value
Purchase Details
Closed on
Sep 9, 1999
Sold by
Faraone Jack R
Bought by
Hall David F and Hall Katherine F
Home Financials for this Owner
Home Financials are based on the most recent Mortgage that was taken out on this home.
Original Mortgage
$216,050
Interest Rate
7.66%
Mortgage Type
Balloon
Create a Home Valuation Report for This Property
The Home Valuation Report is an in-depth analysis detailing your home's value as well as a comparison with similar homes in the area
Home Values in the Area
Average Home Value in this Area
Purchase History
| Date | Buyer | Sale Price | Title Company |
|---|---|---|---|
| Hall David F | -- | Commonwealth Land Title | |
| Hall David F | $270,500 | Fidelity National Title Co |
Source: Public Records
Mortgage History
| Date | Status | Borrower | Loan Amount |
|---|---|---|---|
| Closed | Hall David F | $216,050 | |
| Closed | Hall David F | $54,000 |
Source: Public Records
Tax History
| Year | Tax Paid | Tax Assessment Tax Assessment Total Assessment is a certain percentage of the fair market value that is determined by local assessors to be the total taxable value of land and additions on the property. | Land | Improvement |
|---|---|---|---|---|
| 2025 | $6,905 | $445,702 | $245,906 | $199,796 |
| 2024 | $6,905 | $436,964 | $241,085 | $195,879 |
| 2023 | $6,774 | $428,397 | $236,358 | $192,039 |
| 2022 | $6,730 | $419,998 | $231,724 | $188,274 |
| 2021 | $6,597 | $411,764 | $227,181 | $184,583 |
| 2020 | $6,427 | $407,543 | $224,852 | $182,691 |
| 2019 | $6,266 | $399,553 | $220,444 | $179,109 |
| 2018 | $6,209 | $391,720 | $216,122 | $175,598 |
| 2017 | $6,120 | $384,040 | $211,885 | $172,155 |
| 2016 | $5,823 | $376,511 | $207,731 | $168,780 |
| 2015 | $5,690 | $370,856 | $204,611 | $166,245 |
| 2014 | $5,082 | $363,592 | $200,603 | $162,989 |
Source: Public Records
Map
Nearby Homes
- 6267 Royal Oak Ct
- 6221 Glider Dr
- 536 Curie Dr
- 6230 Current Dr
- 358 Conestoga Way
- 6280 Mountford Dr
- 6325 Malory Dr
- 476 Safari Dr
- 348 Henderson Dr
- 488 Tuscarora Dr
- 616 Brenda Lee Dr
- 6217 Hopi Ct
- 6352 Mayo Dr
- 339 El Portal Way
- 5888 Lean Way
- 189 Coffeeberry Dr
- 444 Roading Dr
- 6460 Standridge Ct
- 440 Ariel Dr
- 6151 Camino Verde Dr Unit A
Your Personal Tour Guide
Ask me questions while you tour the home.