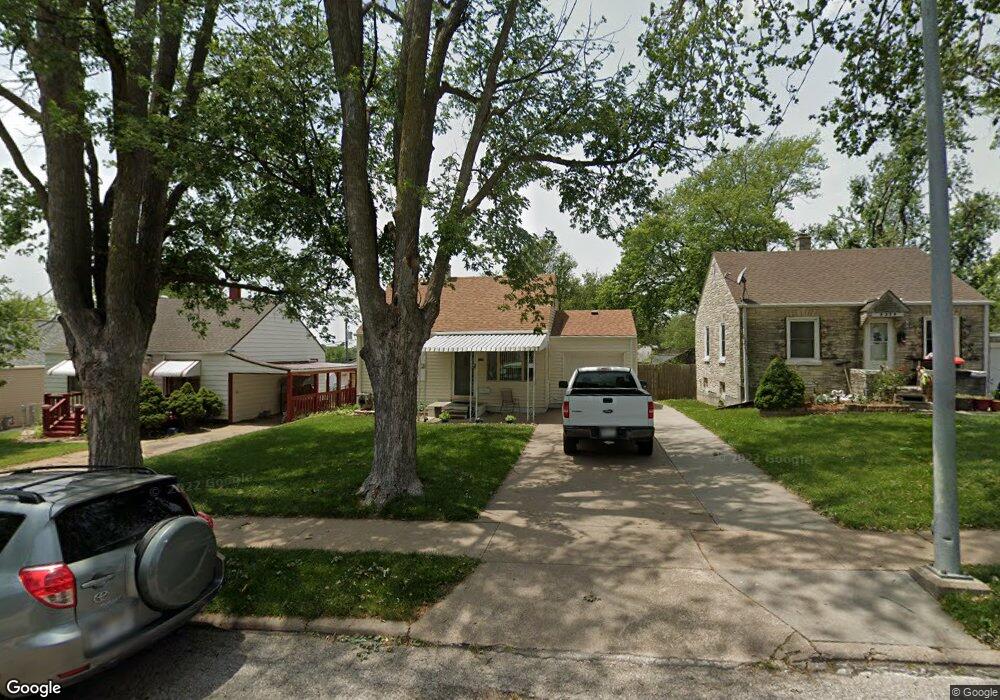
6228 S 39th St Omaha, NE 68107
South Central Omaha NeighborhoodEstimated Value: $164,000 - $211,000
2
Beds
3
Baths
615
Sq Ft
$299/Sq Ft
Est. Value
About This Home
This home is located at 6228 S 39th St, Omaha, NE 68107 and is currently estimated at $184,095, approximately $299 per square foot. 6228 S 39th St is a home located in Douglas County with nearby schools including Gateway Elementary School, Bryan High School, and Sts. Peter and Paul School.
Ownership History
Date
Name
Owned For
Owner Type
Purchase Details
Closed on
Aug 21, 2019
Sold by
Hill Connie
Bought by
Collins Daniel
Current Estimated Value
Home Financials for this Owner
Home Financials are based on the most recent Mortgage that was taken out on this home.
Original Mortgage
$74,500
Outstanding Balance
$65,248
Interest Rate
3.7%
Mortgage Type
New Conventional
Estimated Equity
$118,847
Purchase Details
Closed on
Dec 23, 2002
Sold by
Vacek Cynthia Jo and Vacek Richard W
Bought by
Hill Connie
Home Financials for this Owner
Home Financials are based on the most recent Mortgage that was taken out on this home.
Original Mortgage
$0
Interest Rate
5.96%
Mortgage Type
Stand Alone Second
Create a Home Valuation Report for This Property
The Home Valuation Report is an in-depth analysis detailing your home's value as well as a comparison with similar homes in the area
Home Values in the Area
Average Home Value in this Area
Purchase History
| Date | Buyer | Sale Price | Title Company |
|---|---|---|---|
| Collins Daniel | $145,000 | None Available | |
| Hill Connie | $74,000 | -- |
Source: Public Records
Mortgage History
| Date | Status | Borrower | Loan Amount |
|---|---|---|---|
| Open | Collins Daniel | $74,500 | |
| Previous Owner | Hill Connie | $0 | |
| Previous Owner | Hill Connie | $72,115 |
Source: Public Records
Tax History Compared to Growth
Tax History
| Year | Tax Paid | Tax Assessment Tax Assessment Total Assessment is a certain percentage of the fair market value that is determined by local assessors to be the total taxable value of land and additions on the property. | Land | Improvement |
|---|---|---|---|---|
| 2024 | $3,074 | $153,300 | $11,400 | $141,900 |
| 2023 | $3,074 | $145,700 | $11,400 | $134,300 |
| 2022 | $2,466 | $115,500 | $10,500 | $105,000 |
| 2021 | $2,445 | $115,500 | $10,500 | $105,000 |
| 2020 | $1,850 | $86,400 | $10,500 | $75,900 |
| 2019 | $1,503 | $70,000 | $10,500 | $59,500 |
| 2018 | $1,505 | $70,000 | $10,500 | $59,500 |
| 2017 | $1,442 | $67,200 | $6,200 | $61,000 |
| 2016 | $1,442 | $67,200 | $6,200 | $61,000 |
| 2015 | $1,423 | $67,200 | $6,200 | $61,000 |
| 2014 | $1,423 | $67,200 | $6,200 | $61,000 |
Source: Public Records
Map
Nearby Homes