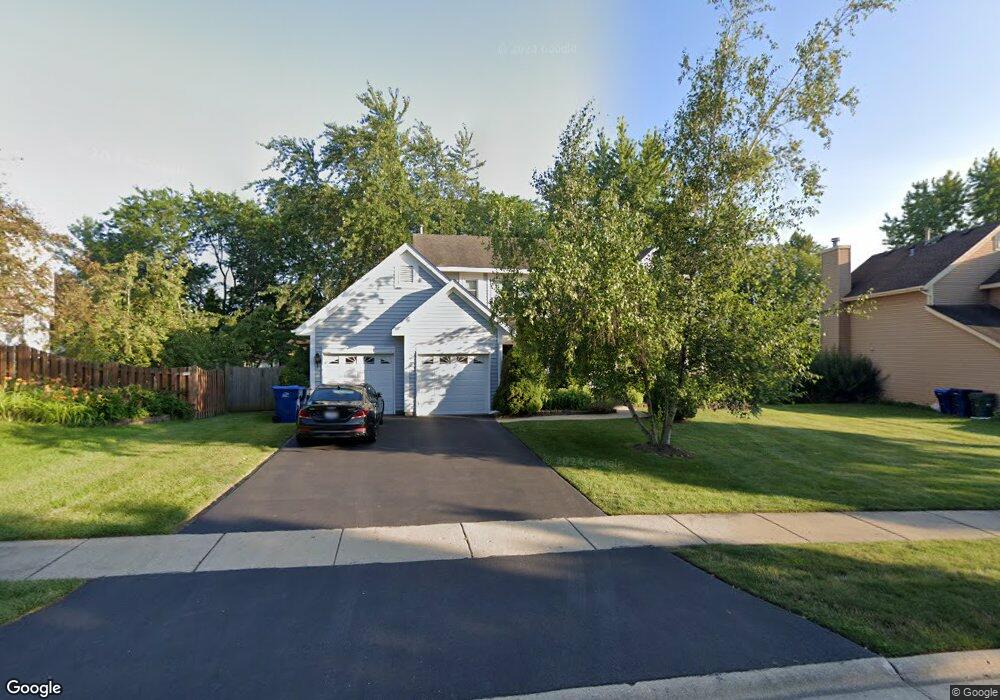
6229 Sleepy Hollow Ln Gurnee, IL 60031
Estimated Value: $407,000 - $430,779
4
Beds
3
Baths
2,232
Sq Ft
$188/Sq Ft
Est. Value
About This Home
This home is located at 6229 Sleepy Hollow Ln, Gurnee, IL 60031 and is currently estimated at $419,195, approximately $187 per square foot. 6229 Sleepy Hollow Ln is a home located in Lake County with nearby schools including Woodland Primary School, Woodland Intermediate School, and Woodland Elementary School.
Ownership History
Date
Name
Owned For
Owner Type
Purchase Details
Closed on
Jul 25, 2018
Sold by
Ellison Robert A and Ellison Shawn M
Bought by
Ellison Robert A and Ellison Shawn M
Current Estimated Value
Purchase Details
Closed on
Mar 31, 2006
Sold by
Navasca Wilfredo T and Navasca Porfiria D
Bought by
Ellison Robert A and Ellison Shawn M
Home Financials for this Owner
Home Financials are based on the most recent Mortgage that was taken out on this home.
Original Mortgage
$261,600
Outstanding Balance
$151,372
Interest Rate
6.48%
Mortgage Type
Fannie Mae Freddie Mac
Estimated Equity
$267,823
Purchase Details
Closed on
Mar 30, 2001
Sold by
Cardenas Teodoro and Cardenas Francy D
Bought by
Navasca Wilfredo T and Navasca Porfiria D
Home Financials for this Owner
Home Financials are based on the most recent Mortgage that was taken out on this home.
Original Mortgage
$218,000
Interest Rate
7.05%
Purchase Details
Closed on
Jan 22, 1996
Sold by
Ozark Linda L
Bought by
Ozark Joseph C
Create a Home Valuation Report for This Property
The Home Valuation Report is an in-depth analysis detailing your home's value as well as a comparison with similar homes in the area
Home Values in the Area
Average Home Value in this Area
Purchase History
| Date | Buyer | Sale Price | Title Company |
|---|---|---|---|
| Ellison Robert A | -- | Attorney | |
| Ellison Robert A | $328,000 | First American Title Ins Co | |
| Navasca Wilfredo T | $243,000 | -- | |
| Ozark Joseph C | -- | First American Title Ins Co |
Source: Public Records
Mortgage History
| Date | Status | Borrower | Loan Amount |
|---|---|---|---|
| Open | Ellison Robert A | $261,600 | |
| Previous Owner | Navasca Wilfredo T | $218,000 |
Source: Public Records
Tax History Compared to Growth
Tax History
| Year | Tax Paid | Tax Assessment Tax Assessment Total Assessment is a certain percentage of the fair market value that is determined by local assessors to be the total taxable value of land and additions on the property. | Land | Improvement |
|---|---|---|---|---|
| 2024 | $9,857 | $116,654 | $17,327 | $99,327 |
| 2023 | $9,657 | $108,304 | $16,087 | $92,217 |
| 2022 | $9,657 | $105,073 | $17,995 | $87,078 |
| 2021 | $8,726 | $100,857 | $17,273 | $83,584 |
| 2020 | $8,443 | $98,377 | $16,848 | $81,529 |
| 2019 | $8,202 | $95,521 | $16,359 | $79,162 |
| 2018 | $4,184 | $96,078 | $18,386 | $77,692 |
| 2017 | $8,061 | $93,325 | $17,859 | $75,466 |
| 2016 | $7,994 | $89,170 | $17,064 | $72,106 |
| 2015 | $7,783 | $84,570 | $16,184 | $68,386 |
| 2014 | $8,325 | $90,634 | $16,070 | $74,564 |
| 2012 | $7,889 | $91,328 | $16,193 | $75,135 |
Source: Public Records
Map
Nearby Homes
- 6191 Oakmont Ln
- 6161 Oakmont Ln
- 6402 Barn Swallow Ct
- 295 N Hunt Club Rd
- 6296 Doral Dr
- 6359 Doral Dr
- 17119 W Prairieview Ln
- 17404 W Walnut Ln Unit 2C
- 650 Whitney Ct Unit 203
- 34040 N White Oak Ln Unit 46C
- 690 Chandler Rd Unit 102
- 690 Chandler Rd Unit 207
- 690 Chandler Rd Unit 305
- 6121 Brookstone Place
- 17429 W Chestnut Ln Unit 13A
- 638 Dordan Ct
- 651 White Ct
- 6091 Washington St
- 17150 Washington St
- 17514 W Bridle Ct
- 6241 Sleepy Hollow Ln Unit 3
- 6207 Sleepy Hollow Ln
- 236 Southridge Dr
- 6232 Sleepy Hollow Ln
- 6253 Sleepy Hollow Ln
- 6216 Sleepy Hollow Ln
- 6248 Sleepy Hollow Ln
- 245 Big Terra Ln
- 228 Southridge Dr
- 240 Southridge Dr
- 249 Big Terra Ln
- 6265 Sleepy Hollow Ln
- 6200 Indian Trail Rd Unit 1
- 6264 Sleepy Hollow Ln Unit 3
- 6201 Indian Trail Rd
- 129 Knobb Hill Ln
- 125 Knobb Hill Ln
- 244 Southridge Dr
- 224 Southridge Dr
- 225 Southridge Dr