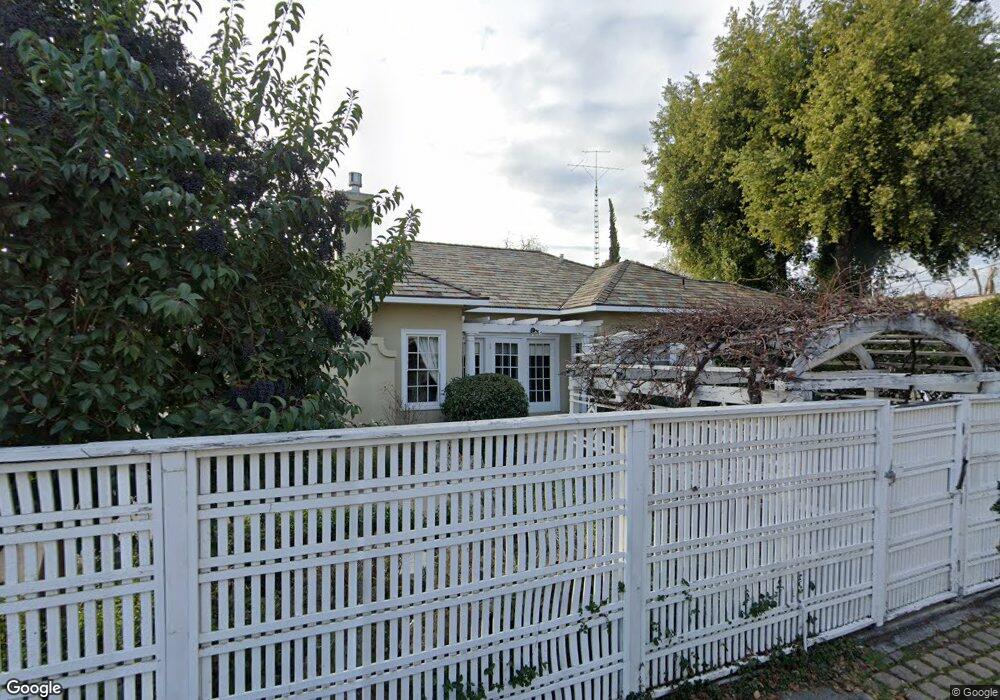
623 19th St Paso Robles, CA 93446
Estimated Value: $786,000 - $1,016,000
2
Beds
1
Bath
1,867
Sq Ft
$477/Sq Ft
Est. Value
About This Home
This home is located at 623 19th St, Paso Robles, CA 93446 and is currently estimated at $890,333, approximately $476 per square foot. 623 19th St is a home located in San Luis Obispo County with nearby schools including Glen Speck Elementary School, George H. Flamson Middle School, and Paso Robles High School.
Ownership History
Date
Name
Owned For
Owner Type
Purchase Details
Closed on
Apr 4, 2013
Sold by
West Dick A and West Nancy J
Bought by
Douglas Montgomery Company Inc
Current Estimated Value
Purchase Details
Closed on
Sep 17, 2009
Sold by
Lithwin Aimee B and West Aaron B
Bought by
West Dick A and West Nancy J
Purchase Details
Closed on
Nov 25, 2008
Sold by
West Dick A and West Nancy J
Bought by
Lithwin Aimee B and West Aaron B
Purchase Details
Closed on
Nov 19, 1996
Sold by
Frane Norbert L
Bought by
West Dick A and West Nancy J
Create a Home Valuation Report for This Property
The Home Valuation Report is an in-depth analysis detailing your home's value as well as a comparison with similar homes in the area
Purchase History
| Date | Buyer | Sale Price | Title Company |
|---|---|---|---|
| Douglas Montgomery Company Inc | -- | None Available | |
| West Dick A | -- | None Available | |
| Lithwin Aimee B | -- | None Available | |
| West Dick A | -- | -- |
Source: Public Records
Tax History
| Year | Tax Paid | Tax Assessment Tax Assessment Total Assessment is a certain percentage of the fair market value that is determined by local assessors to be the total taxable value of land and additions on the property. | Land | Improvement |
|---|---|---|---|---|
| 2025 | $4,832 | $443,300 | $147,765 | $295,535 |
| 2024 | $4,753 | $434,609 | $144,868 | $289,741 |
| 2023 | $4,753 | $426,088 | $142,028 | $284,060 |
| 2022 | $4,682 | $417,735 | $139,244 | $278,491 |
| 2021 | $4,602 | $409,545 | $136,514 | $273,031 |
| 2020 | $4,540 | $405,347 | $135,115 | $270,232 |
| 2019 | $4,475 | $397,400 | $132,466 | $264,934 |
| 2018 | $4,415 | $389,609 | $129,869 | $259,740 |
| 2017 | $4,151 | $381,971 | $127,323 | $254,648 |
| 2016 | $4,070 | $374,482 | $124,827 | $249,655 |
| 2015 | $4,054 | $368,857 | $122,952 | $245,905 |
| 2014 | $3,914 | $361,633 | $120,544 | $241,089 |
Source: Public Records
Map
Nearby Homes
Your Personal Tour Guide
Ask me questions while you tour the home.