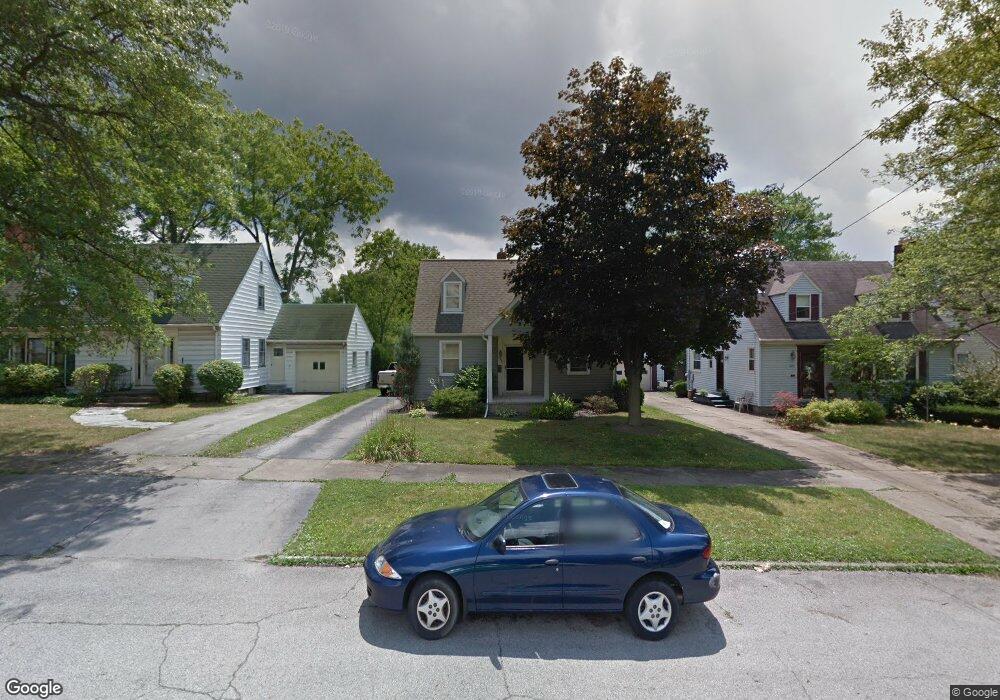
623 E Kline St Girard, OH 44420
Estimated Value: $129,000 - $192,000
3
Beds
1
Bath
1,236
Sq Ft
$121/Sq Ft
Est. Value
About This Home
This home is located at 623 E Kline St, Girard, OH 44420 and is currently estimated at $149,812, approximately $121 per square foot. 623 E Kline St is a home located in Trumbull County with nearby schools including Prospect Elementary School, Girard Intermediate School, and Girard Junior High School.
Ownership History
Date
Name
Owned For
Owner Type
Purchase Details
Closed on
Nov 4, 2025
Sold by
Cornell Charles E and Cornell Steven Charles
Bought by
Cornell Charles E and Cornell Steven Charles
Current Estimated Value
Purchase Details
Closed on
Nov 10, 2014
Sold by
Cornell Charles E and Cornell George Bradford
Bought by
Cornell Charles E and Cornell Steven Charles
Home Financials for this Owner
Home Financials are based on the most recent Mortgage that was taken out on this home.
Original Mortgage
$49,000
Interest Rate
3.26%
Mortgage Type
New Conventional
Purchase Details
Closed on
Jun 28, 2001
Sold by
Wortman Rachel G and Cornell Rachel G
Bought by
Cornell Charles E and Cornell George Bradford
Purchase Details
Closed on
Apr 21, 1995
Sold by
Parker Bradley C
Bought by
Cornell Charles E and Cornell Rachel G
Home Financials for this Owner
Home Financials are based on the most recent Mortgage that was taken out on this home.
Original Mortgage
$68,964
Interest Rate
8.64%
Mortgage Type
New Conventional
Purchase Details
Closed on
Jan 1, 1990
Bought by
Bradley C Parker
Create a Home Valuation Report for This Property
The Home Valuation Report is an in-depth analysis detailing your home's value as well as a comparison with similar homes in the area
Home Values in the Area
Average Home Value in this Area
Purchase History
| Date | Buyer | Sale Price | Title Company |
|---|---|---|---|
| Cornell Charles E | -- | None Listed On Document | |
| Cornell Charles E | -- | First American Title Ins Co | |
| Cornell Charles E | -- | -- | |
| Cornell Charles E | $69,000 | -- | |
| Bradley C Parker | -- | -- |
Source: Public Records
Mortgage History
| Date | Status | Borrower | Loan Amount |
|---|---|---|---|
| Previous Owner | Cornell Charles E | $49,000 | |
| Previous Owner | Cornell Charles E | $68,964 |
Source: Public Records
Tax History
| Year | Tax Paid | Tax Assessment Tax Assessment Total Assessment is a certain percentage of the fair market value that is determined by local assessors to be the total taxable value of land and additions on the property. | Land | Improvement |
|---|---|---|---|---|
| 2024 | $1,087 | $36,760 | $4,100 | $32,660 |
| 2023 | $1,117 | $36,760 | $4,100 | $32,660 |
| 2022 | $747 | $23,040 | $4,100 | $18,940 |
| 2021 | $749 | $23,040 | $4,100 | $18,940 |
| 2020 | $759 | $23,040 | $4,100 | $18,940 |
| 2019 | $706 | $21,320 | $4,100 | $17,220 |
| 2018 | $740 | $21,320 | $4,100 | $17,220 |
| 2017 | $737 | $21,320 | $4,100 | $17,220 |
| 2016 | $633 | $19,150 | $4,100 | $15,050 |
| 2015 | $1,153 | $19,150 | $4,100 | $15,050 |
| 2014 | $1,153 | $19,150 | $4,100 | $15,050 |
| 2013 | $1,208 | $20,450 | $4,100 | $16,350 |
Source: Public Records
Map
Nearby Homes
- 417 Otis Ct SE
- 500 Forsythe Ave
- 238 E Main St
- 216 E Main St
- 521 Powers Ave
- 349 Forsythe Ave
- 445 Powers Ave
- 148 E Wilson Ave
- 202 E Prospect St
- 1094 Churchill Rd
- 131 S State St
- 0 S State St Unit 5124606
- 620 Washington Ave
- 0 W Wilson Ave
- 401 Indiana Ave
- 111 Churchill Rd
- 970 N Ward Ave
- 126 Churchill Rd
- 36 Churchill Rd
- 114 Townsend Ave
Your Personal Tour Guide
Ask me questions while you tour the home.