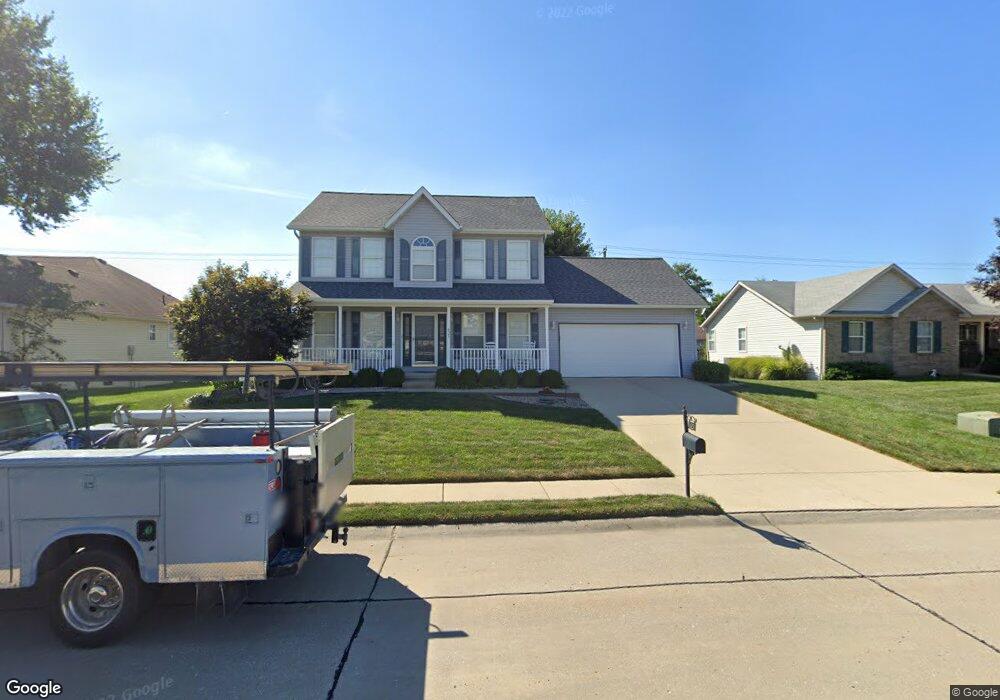
623 Glen Mor Belleville, IL 62221
Estimated Value: $277,000 - $315,000
3
Beds
3
Baths
1,800
Sq Ft
$160/Sq Ft
Est. Value
About This Home
This home is located at 623 Glen Mor, Belleville, IL 62221 and is currently estimated at $287,372, approximately $159 per square foot. 623 Glen Mor is a home located in St. Clair County with nearby schools including Whiteside Elementary School, Whiteside Middle School, and St. Clare Catholic School.
Ownership History
Date
Name
Owned For
Owner Type
Purchase Details
Closed on
Sep 24, 2007
Sold by
Brown Kathryn M
Bought by
Brown Kathryn and Tylka James
Current Estimated Value
Home Financials for this Owner
Home Financials are based on the most recent Mortgage that was taken out on this home.
Original Mortgage
$318,966
Interest Rate
6.7%
Mortgage Type
Purchase Money Mortgage
Purchase Details
Closed on
Sep 14, 2007
Sold by
James Reginald L and James Reeshemah D
Bought by
Brown Kathryn M
Home Financials for this Owner
Home Financials are based on the most recent Mortgage that was taken out on this home.
Original Mortgage
$318,966
Interest Rate
6.7%
Mortgage Type
Purchase Money Mortgage
Purchase Details
Closed on
Aug 17, 2004
Sold by
Sletten Mark Wayne and Sletten Lisa Van Lieu
Bought by
James Reginald L and James Reeshemah D
Home Financials for this Owner
Home Financials are based on the most recent Mortgage that was taken out on this home.
Original Mortgage
$178,339
Interest Rate
6.1%
Mortgage Type
VA
Create a Home Valuation Report for This Property
The Home Valuation Report is an in-depth analysis detailing your home's value as well as a comparison with similar homes in the area
Home Values in the Area
Average Home Value in this Area
Purchase History
| Date | Buyer | Sale Price | Title Company |
|---|---|---|---|
| Brown Kathryn | -- | First American Title Ins Co | |
| Brown Kathryn M | $190,000 | First American Title Ins Co | |
| James Reginald L | $174,500 | Town & Country Title Co |
Source: Public Records
Mortgage History
| Date | Status | Borrower | Loan Amount |
|---|---|---|---|
| Previous Owner | Brown Kathryn M | $318,966 | |
| Previous Owner | James Reginald L | $178,339 |
Source: Public Records
Tax History Compared to Growth
Tax History
| Year | Tax Paid | Tax Assessment Tax Assessment Total Assessment is a certain percentage of the fair market value that is determined by local assessors to be the total taxable value of land and additions on the property. | Land | Improvement |
|---|---|---|---|---|
| 2024 | $4,692 | $74,820 | $11,972 | $62,848 |
| 2023 | $4,543 | $70,896 | $11,807 | $59,089 |
| 2022 | $3,917 | $64,568 | $10,753 | $53,815 |
| 2021 | $3,825 | $61,918 | $10,312 | $51,606 |
| 2020 | $3,691 | $57,663 | $9,603 | $48,060 |
| 2019 | $3,444 | $55,972 | $10,486 | $45,486 |
| 2018 | $3,365 | $54,543 | $10,218 | $44,325 |
| 2017 | $1,702 | $53,091 | $9,946 | $43,145 |
| 2016 | $3,372 | $51,261 | $9,603 | $41,658 |
| 2014 | $1,546 | $51,312 | $11,255 | $40,057 |
| 2013 | $3,485 | $51,312 | $11,255 | $40,057 |
Source: Public Records
Map
Nearby Homes
- 651 Glen Mor
- 612 Westfield Ct
- 520 Country Meadow Ln
- 714 Oxen Dr
- 713 Oxen Dr
- 2652 Cheyenne Wells Dr
- 2605 Cheyenne Wells Dr
- 2604 Windsor Crest Ct
- Whitney Plan at Greystone Estates
- Franklin Plan at Greystone Estates
- Wright Plan at Greystone Estates
- Jefferson Plan at Greystone Estates
- Lynwood Plan at Greystone Estates
- Carnegie Plan at Greystone Estates
- 3422 Chippewa Dr
- 2290 Wellington Dr
- 2708 Ambridge Dr
- 2224 Cotswold Cir
- 2237 Glenfield Dr
- 220 Country Meadow Ln
- 627 Glen Mor
- 619 Glen Mor
- 720 Saint John Dr
- 716 Saint John Dr
- 631 Glen Mor
- 2611 Piper Hills Dr
- 615 Glen Mor
- 724 Saint John Dr
- 2612 Pipers Ct
- 712 Saint John Dr
- 712 St John
- 728 Saint John Dr
- 728 St John
- 635 Glen Mor
- 611 Glen Mor
- 2615 Piper Hills Dr
- 2610 Piper Hills Dr
- 708 Saint John Dr
- 2616 Pipers Ct
- 800 St John Dr