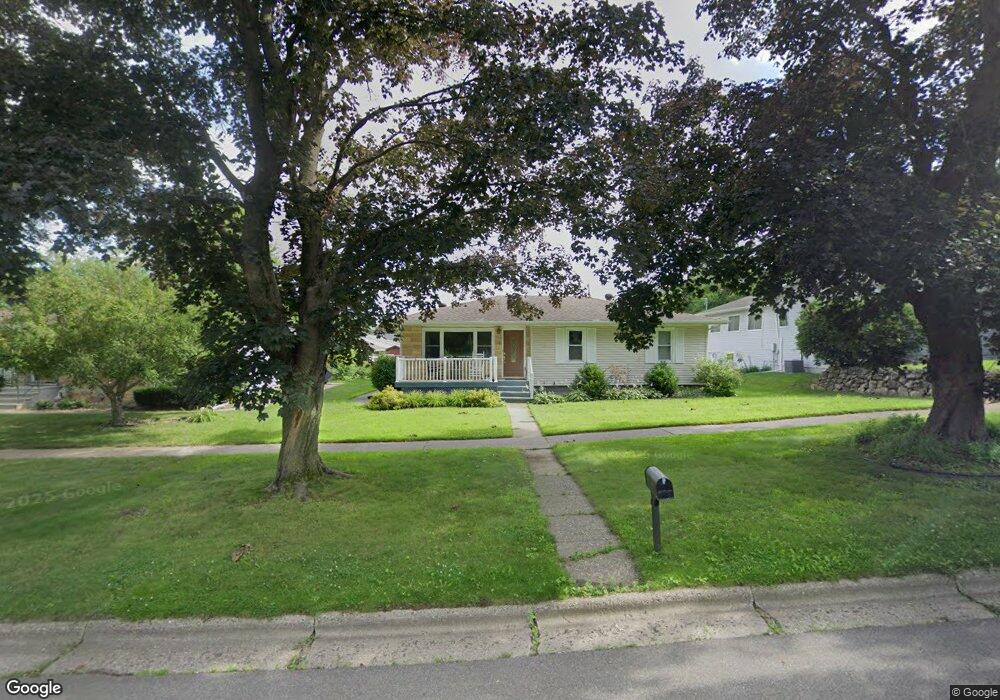
623 Main St La Crescent, MN 55947
Estimated Value: $260,000 - $329,000
3
Beds
1
Bath
1,540
Sq Ft
$195/Sq Ft
Est. Value
About This Home
This home is located at 623 Main St, La Crescent, MN 55947 and is currently estimated at $300,438, approximately $195 per square foot. 623 Main St is a home located in Houston County with nearby schools including La Crescent-Hokah Elementary School, La Crescent-Hokah Middle School, and La Crescent-Hokah High School.
Ownership History
Date
Name
Owned For
Owner Type
Purchase Details
Closed on
Nov 1, 2017
Sold by
Schmidt Kathleen A and Schmidt James A
Bought by
Mahlum Ryan J
Current Estimated Value
Home Financials for this Owner
Home Financials are based on the most recent Mortgage that was taken out on this home.
Original Mortgage
$144,000
Outstanding Balance
$120,888
Interest Rate
3.92%
Mortgage Type
Adjustable Rate Mortgage/ARM
Estimated Equity
$179,550
Purchase Details
Closed on
Apr 13, 2010
Sold by
Schmidt Kathleen A and Schmidt James A
Bought by
Schmidt Katheleen A and Schmidt James A
Create a Home Valuation Report for This Property
The Home Valuation Report is an in-depth analysis detailing your home's value as well as a comparison with similar homes in the area
Home Values in the Area
Average Home Value in this Area
Purchase History
| Date | Buyer | Sale Price | Title Company |
|---|---|---|---|
| Mahlum Ryan J | $172,000 | -- | |
| Schmidt Katheleen A | -- | None Available |
Source: Public Records
Mortgage History
| Date | Status | Borrower | Loan Amount |
|---|---|---|---|
| Open | Mahlum Ryan J | $144,000 |
Source: Public Records
Tax History
| Year | Tax Paid | Tax Assessment Tax Assessment Total Assessment is a certain percentage of the fair market value that is determined by local assessors to be the total taxable value of land and additions on the property. | Land | Improvement |
|---|---|---|---|---|
| 2025 | $3,736 | $298,600 | $43,100 | $255,500 |
| 2024 | $3,978 | $273,600 | $43,100 | $230,500 |
| 2023 | $4,130 | $272,400 | $29,300 | $243,100 |
| 2022 | $3,740 | $272,400 | $29,300 | $243,100 |
| 2021 | $4,164 | $198,200 | $29,300 | $168,900 |
| 2020 | $3,864 | $198,200 | $29,300 | $168,900 |
| 2019 | $2,838 | $190,900 | $29,300 | $161,600 |
| 2018 | $2,058 | $170,700 | $29,300 | $141,400 |
| 2017 | $2,058 | $113,800 | $24,139 | $89,661 |
| 2016 | $1,808 | $138,600 | $29,400 | $109,200 |
| 2015 | $1,702 | $131,200 | $27,800 | $103,400 |
| 2014 | $1,702 | $105,800 | $22,418 | $83,382 |
Source: Public Records
Map
Nearby Homes
- 109 N Hill St
- 604 Hickory Ct
- 812 Bridle Ln
- 805 Bridle Ln
- 512 N Hill St
- 440 S 7th St
- 0 Hill St N
- 221 N 4th St
- 114 Fireside Ct
- 726 N 4th St
- Lot 7 & 8 Crescent Hills Dr
- 906 Redwood St W
- 203 Eagles Bluff Rd
- 709 Wildwood Ct
- 912 S Oak St
- 348 Regent Dr
- 0 Hickory Ln
- 1600 West Ln
- 36 Skunk Hollow Rd
- 134 Mcintosh Rd E
Your Personal Tour Guide
Ask me questions while you tour the home.