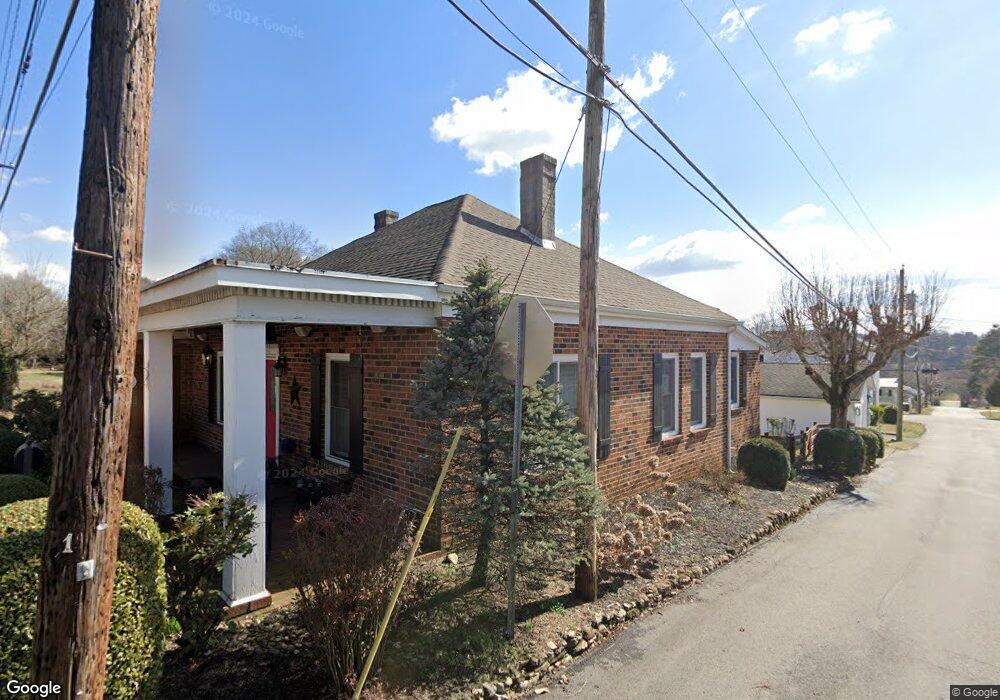
623 Mulberry St Loudon, TN 37774
Estimated Value: $300,000 - $439,000
Studio
2
Baths
2,151
Sq Ft
$159/Sq Ft
Est. Value
About This Home
This home is located at 623 Mulberry St, Loudon, TN 37774 and is currently estimated at $342,816, approximately $159 per square foot. 623 Mulberry St is a home located in Loudon County with nearby schools including Loudon High School.
Ownership History
Date
Name
Owned For
Owner Type
Purchase Details
Closed on
Oct 31, 2024
Sold by
Newman John R and Newman Stephanie B
Bought by
Lamb Leigh Alexander
Current Estimated Value
Purchase Details
Closed on
Jun 14, 2011
Bought by
Newman John R
Purchase Details
Closed on
Mar 6, 2008
Sold by
Newman John R
Bought by
Newman John R
Purchase Details
Closed on
Apr 28, 2006
Sold by
James Wilkins A
Bought by
Newman John R
Purchase Details
Closed on
Feb 9, 2005
Sold by
Stewart Samuel A
Bought by
James Wilkins A
Create a Home Valuation Report for This Property
The Home Valuation Report is an in-depth analysis detailing your home's value as well as a comparison with similar homes in the area
Home Values in the Area
Average Home Value in this Area
Purchase History
| Date | Buyer | Sale Price | Title Company |
|---|---|---|---|
| Lamb Leigh Alexander | $329,800 | Southeastern Title | |
| Newman John R | -- | -- | |
| Newman John R | -- | -- | |
| Newman John R | $58,000 | -- | |
| James Wilkins A | $112,000 | -- |
Source: Public Records
Tax History
| Year | Tax Paid | Tax Assessment Tax Assessment Total Assessment is a certain percentage of the fair market value that is determined by local assessors to be the total taxable value of land and additions on the property. | Land | Improvement |
|---|---|---|---|---|
| 2025 | $912 | $51,575 | $4,325 | $47,250 |
| 2024 | $1,350 | $51,575 | $4,325 | $47,250 |
| 2023 | $1,350 | $51,575 | $0 | $0 |
| 2022 | $1,350 | $51,575 | $4,325 | $47,250 |
| 2021 | $1,350 | $51,575 | $4,325 | $47,250 |
| 2020 | $1,117 | $51,575 | $4,325 | $47,250 |
| 2019 | $1,117 | $36,750 | $4,350 | $32,400 |
| 2018 | $1,095 | $36,750 | $4,350 | $32,400 |
| 2017 | $1,095 | $36,750 | $4,350 | $32,400 |
| 2016 | $1,075 | $35,400 | $4,550 | $30,850 |
| 2015 | $1,075 | $35,400 | $4,550 | $30,850 |
| 2014 | $1,075 | $35,400 | $4,550 | $30,850 |
Source: Public Records
Map
Nearby Homes
Your Personal Tour Guide
Ask me questions while you tour the home.