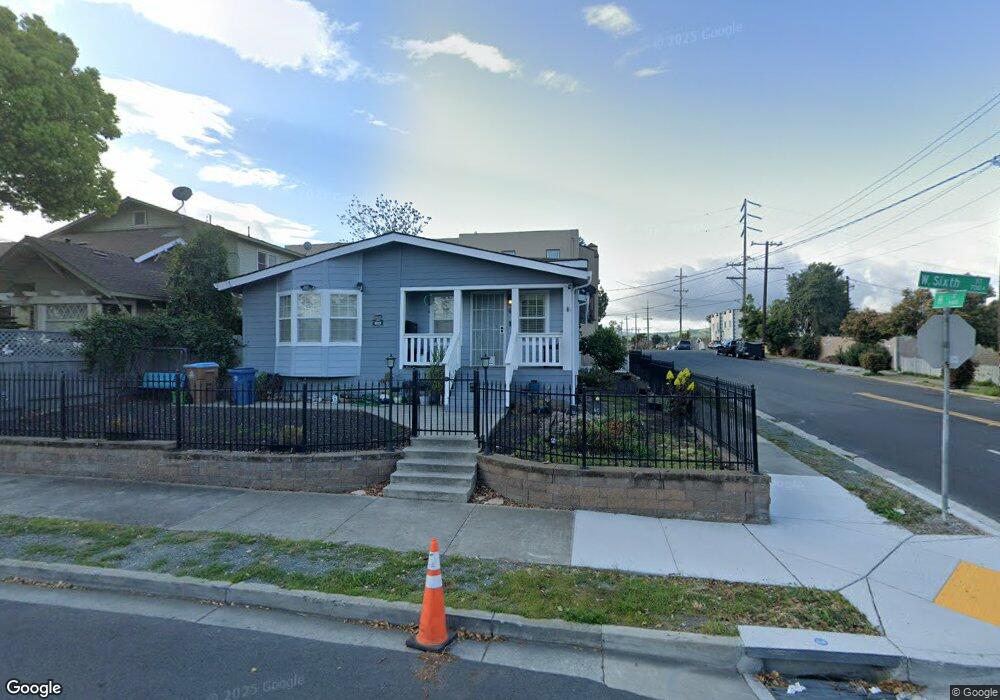
623 W 6th St Antioch, CA 94509
North Antioch NeighborhoodEstimated Value: $358,000 - $572,000
3
Beds
2
Baths
1,582
Sq Ft
$292/Sq Ft
Est. Value
About This Home
This home is located at 623 W 6th St, Antioch, CA 94509 and is currently estimated at $461,851, approximately $291 per square foot. 623 W 6th St is a home located in Contra Costa County with nearby schools including Fremont Elementary School, Antioch Middle School, and Antioch High School.
Ownership History
Date
Name
Owned For
Owner Type
Purchase Details
Closed on
Jul 26, 2019
Sold by
Gonzalez Marco A and Topete Isela
Bought by
Topele Isela
Current Estimated Value
Purchase Details
Closed on
Mar 20, 2012
Sold by
California Housing Finance Agency
Bought by
Gonzalez Marco A and Gonzalez Isela
Purchase Details
Closed on
Aug 30, 2010
Sold by
Bryant Carolyn A
Bought by
California Housing Finance Agency
Purchase Details
Closed on
Dec 26, 2006
Sold by
Carter Susan M
Bought by
Bryant Carolyn A
Home Financials for this Owner
Home Financials are based on the most recent Mortgage that was taken out on this home.
Original Mortgage
$437,500
Interest Rate
6.22%
Mortgage Type
New Conventional
Purchase Details
Closed on
Sep 26, 2005
Sold by
Carter Patrick
Bought by
Carter Susan M
Home Financials for this Owner
Home Financials are based on the most recent Mortgage that was taken out on this home.
Original Mortgage
$270,000
Interest Rate
5.37%
Mortgage Type
Fannie Mae Freddie Mac
Purchase Details
Closed on
Sep 2, 2003
Sold by
Carter Mary Ann
Bought by
Carter Patrick
Home Financials for this Owner
Home Financials are based on the most recent Mortgage that was taken out on this home.
Original Mortgage
$255,600
Interest Rate
5.35%
Mortgage Type
Purchase Money Mortgage
Purchase Details
Closed on
May 1, 2002
Sold by
Costa Thomas
Bought by
Higgins Sandra J
Home Financials for this Owner
Home Financials are based on the most recent Mortgage that was taken out on this home.
Original Mortgage
$100,000
Interest Rate
7.18%
Mortgage Type
Purchase Money Mortgage
Purchase Details
Closed on
Oct 30, 2001
Sold by
Costa Thomas and Costa Suzanne E
Bought by
Costa Thomas
Home Financials for this Owner
Home Financials are based on the most recent Mortgage that was taken out on this home.
Original Mortgage
$164,450
Interest Rate
7.17%
Mortgage Type
Construction
Purchase Details
Closed on
May 24, 2000
Sold by
Lippow Development Co
Bought by
Costa Thomas
Create a Home Valuation Report for This Property
The Home Valuation Report is an in-depth analysis detailing your home's value as well as a comparison with similar homes in the area
Home Values in the Area
Average Home Value in this Area
Purchase History
| Date | Buyer | Sale Price | Title Company |
|---|---|---|---|
| Topele Isela | -- | None Available | |
| Gonzalez Marco A | $100,000 | First American Title Company | |
| California Housing Finance Agency | $477,866 | Landsafe Title | |
| Bryant Carolyn A | $450,000 | Fidelity National Title Co | |
| Carter Susan M | $180,000 | Ticor Title Company | |
| Carter Patrick | -- | Ticor Title Company | |
| Carter Susan M | $284,000 | Ticor Title Company | |
| Higgins Sandra J | $250,000 | Fidelity National Title Co | |
| Costa Thomas | -- | Fidelity National Title | |
| Costa Thomas | $40,000 | North American Title Co |
Source: Public Records
Mortgage History
| Date | Status | Borrower | Loan Amount |
|---|---|---|---|
| Previous Owner | Bryant Carolyn A | $437,500 | |
| Previous Owner | Carter Susan M | $270,000 | |
| Previous Owner | Carter Susan M | $255,600 | |
| Previous Owner | Higgins Sandra J | $100,000 | |
| Previous Owner | Costa Thomas | $164,450 |
Source: Public Records
Tax History
| Year | Tax Paid | Tax Assessment Tax Assessment Total Assessment is a certain percentage of the fair market value that is determined by local assessors to be the total taxable value of land and additions on the property. | Land | Improvement |
|---|---|---|---|---|
| 2025 | $1,903 | $125,594 | $56,518 | $69,076 |
| 2024 | $1,780 | $123,132 | $55,410 | $67,722 |
| 2023 | $1,780 | $120,719 | $54,324 | $66,395 |
| 2022 | $1,756 | $118,353 | $53,259 | $65,094 |
| 2021 | $1,687 | $116,033 | $52,215 | $63,818 |
| 2019 | $1,642 | $112,593 | $50,667 | $61,926 |
| 2018 | $1,660 | $110,386 | $49,674 | $60,712 |
| 2017 | $1,612 | $108,222 | $48,700 | $59,522 |
| 2016 | $1,560 | $106,101 | $47,746 | $58,355 |
| 2015 | $1,536 | $104,508 | $47,029 | $57,479 |
| 2014 | $1,486 | $102,462 | $46,108 | $56,354 |
Source: Public Records
Map
Nearby Homes
Your Personal Tour Guide
Ask me questions while you tour the home.