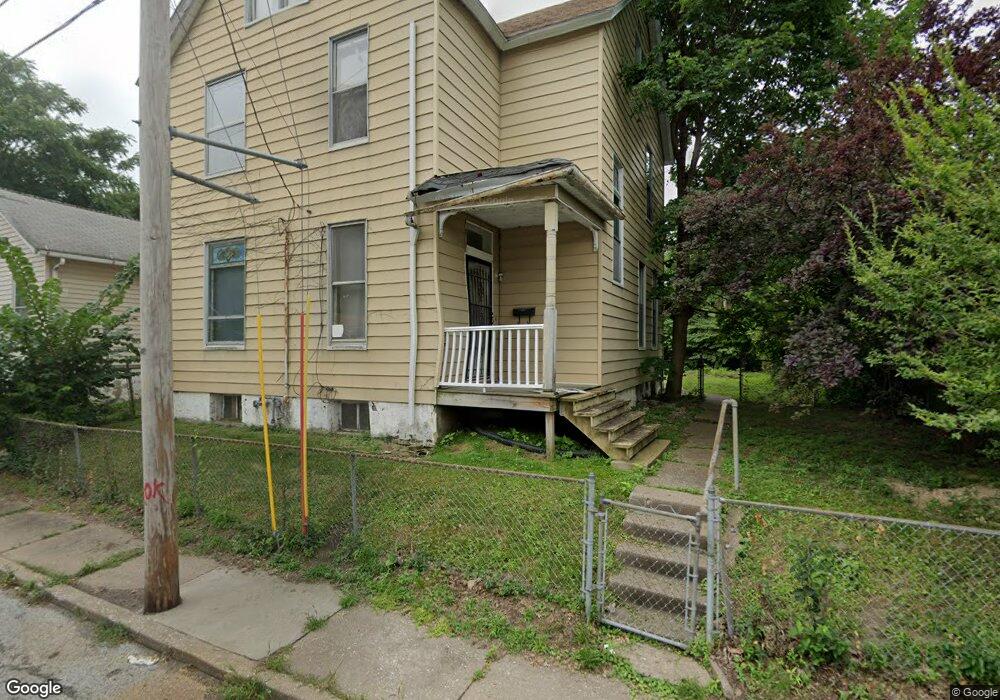
623 W 9th St Davenport, IA 52803
Central Davenport NeighborhoodEstimated Value: $87,000 - $93,000
3
Beds
2
Baths
1,766
Sq Ft
$51/Sq Ft
Est. Value
About This Home
This home is located at 623 W 9th St, Davenport, IA 52803 and is currently estimated at $90,734, approximately $51 per square foot. 623 W 9th St is a home located in Scott County with nearby schools including Walnut Hill Elementary School, Crofton Elementary School, and Casey County Middle School.
Ownership History
Date
Name
Owned For
Owner Type
Purchase Details
Closed on
Sep 21, 2023
Sold by
Future Capital Llc
Bought by
Parkside Lending Llc
Current Estimated Value
Purchase Details
Closed on
Jun 30, 2020
Sold by
Rodriguez Alejandro and Rodriguez Jessica
Bought by
Future Capital Llc
Home Financials for this Owner
Home Financials are based on the most recent Mortgage that was taken out on this home.
Original Mortgage
$53,400
Interest Rate
3.1%
Mortgage Type
New Conventional
Purchase Details
Closed on
May 30, 2007
Sold by
Johnson Lois
Bought by
Hibbs Michael A
Create a Home Valuation Report for This Property
The Home Valuation Report is an in-depth analysis detailing your home's value as well as a comparison with similar homes in the area
Home Values in the Area
Average Home Value in this Area
Purchase History
| Date | Buyer | Sale Price | Title Company |
|---|---|---|---|
| Parkside Lending Llc | -- | None Listed On Document | |
| Future Capital Llc | $24,000 | None Available | |
| Hibbs Michael A | $19,000 | None Available |
Source: Public Records
Mortgage History
| Date | Status | Borrower | Loan Amount |
|---|---|---|---|
| Previous Owner | Future Capital Llc | $53,400 |
Source: Public Records
Tax History Compared to Growth
Tax History
| Year | Tax Paid | Tax Assessment Tax Assessment Total Assessment is a certain percentage of the fair market value that is determined by local assessors to be the total taxable value of land and additions on the property. | Land | Improvement |
|---|---|---|---|---|
| 2025 | $506 | $29,130 | $13,650 | $15,480 |
| 2024 | $998 | $28,290 | $13,650 | $14,640 |
| 2023 | $722 | $57,220 | $13,650 | $43,570 |
| 2022 | $726 | $33,820 | $6,720 | $27,100 |
| 2021 | $726 | $33,820 | $6,720 | $27,100 |
| 2020 | $646 | $29,700 | $6,720 | $22,980 |
| 2019 | $666 | $29,700 | $6,720 | $22,980 |
| 2018 | $690 | $29,700 | $6,720 | $22,980 |
| 2017 | $720 | $31,450 | $6,720 | $24,730 |
| 2016 | $914 | $31,650 | $0 | $0 |
| 2015 | $694 | $40,290 | $0 | $0 |
| 2014 | $894 | $40,290 | $0 | $0 |
| 2013 | $880 | $0 | $0 | $0 |
| 2012 | -- | $44,040 | $6,000 | $38,040 |
Source: Public Records
Map
Nearby Homes