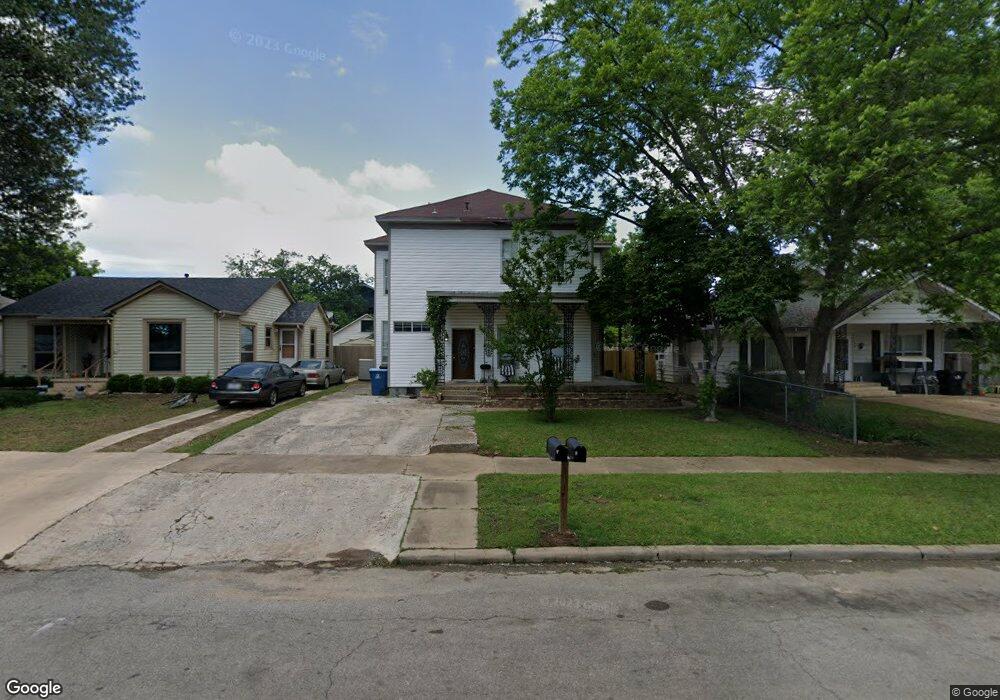
623 W Owing St Unit 2 Down Denison, TX 75020
Downtown Denison NeighborhoodEstimated Value: $241,000 - $276,515
3
Beds
2
Baths
1,600
Sq Ft
$162/Sq Ft
Est. Value
About This Home
This home is located at 623 W Owing St Unit 2 Down, Denison, TX 75020 and is currently estimated at $258,758, approximately $161 per square foot. 623 W Owing St Unit 2 Down is a home located in Grayson County with nearby schools including Terrell Elementary School, Scott Middle School, and Denison High School.
Ownership History
Date
Name
Owned For
Owner Type
Purchase Details
Closed on
Nov 14, 2016
Sold by
Finance Of America Reverse Llc
Bought by
Dfw Metro Housing Llc
Current Estimated Value
Purchase Details
Closed on
Apr 12, 2016
Sold by
Tarter Jesse J and Tarter Evelyn L
Bought by
Finance Of America Reverse Llc
Purchase Details
Closed on
Oct 14, 2011
Sold by
Tarter Jess J and Tarter Evelyn L
Bought by
Tarter Jesse J and Tarter Evelyn L
Home Financials for this Owner
Home Financials are based on the most recent Mortgage that was taken out on this home.
Original Mortgage
$184,500
Interest Rate
4.17%
Mortgage Type
Reverse Mortgage Home Equity Conversion Mortgage
Purchase Details
Closed on
Dec 18, 2006
Sold by
Arroyo Itzel and Perez Itzel
Bought by
Tarter Jess J and Tarter Evelyn L
Home Financials for this Owner
Home Financials are based on the most recent Mortgage that was taken out on this home.
Original Mortgage
$56,000
Interest Rate
6.3%
Mortgage Type
Purchase Money Mortgage
Create a Home Valuation Report for This Property
The Home Valuation Report is an in-depth analysis detailing your home's value as well as a comparison with similar homes in the area
Home Values in the Area
Average Home Value in this Area
Purchase History
| Date | Buyer | Sale Price | Title Company |
|---|---|---|---|
| Dfw Metro Housing Llc | -- | None Available | |
| Finance Of America Reverse Llc | $36,000 | None Available | |
| Tarter Jesse J | -- | None Available | |
| Tarter Jess J | -- | Red River Title Co |
Source: Public Records
Mortgage History
| Date | Status | Borrower | Loan Amount |
|---|---|---|---|
| Previous Owner | Tarter Jesse J | $184,500 | |
| Previous Owner | Tarter Jess J | $56,000 |
Source: Public Records
Tax History Compared to Growth
Tax History
| Year | Tax Paid | Tax Assessment Tax Assessment Total Assessment is a certain percentage of the fair market value that is determined by local assessors to be the total taxable value of land and additions on the property. | Land | Improvement |
|---|---|---|---|---|
| 2025 | $5,484 | $225,288 | $40,800 | $184,488 |
| 2024 | $5,484 | $236,023 | $52,500 | $183,523 |
| 2023 | $4,748 | $209,558 | $31,500 | $178,058 |
| 2022 | $4,761 | $200,384 | $31,500 | $168,884 |
| 2021 | $3,936 | $156,042 | $16,200 | $139,842 |
| 2020 | $3,961 | $150,153 | $13,500 | $136,653 |
| 2019 | $4,050 | $147,168 | $8,160 | $139,008 |
| 2018 | $3,629 | $130,821 | $6,960 | $123,861 |
| 2017 | $2,554 | $91,284 | $3,360 | $87,924 |
| 2016 | $2,829 | $101,114 | $3,960 | $97,154 |
| 2015 | $1,012 | $85,902 | $3,240 | $82,662 |
| 2014 | $1,162 | $86,029 | $3,240 | $82,789 |
Source: Public Records
Map
Nearby Homes
- 609 W Owing St
- 705 W Crawford St
- 618 W Chestnut St
- 627 W Chestnut St
- 826 W Crawford St
- 831 W Owing St
- 702 S Barrett Ave
- 506 W Woodard St
- TBD W Main St
- 330 W Morgan St
- 326-328 W Morgan St
- 920 W Morgan St
- 811 W Woodard St
- 720 W Gandy St
- 830 W Shepherd St
- 615 W Gandy St
- 904 W Shepherd St
- 621 W Munson St
- 1027 W Crawford St
- 408 W Day St
- 623 W Owing St
- 623 W Owings St
- 623 W Owings St Unit 2 Down
- 619 W Owing St
- 627 W Owing St
- 631 W Owing St
- 310 S Barrett Ave Unit 101
- 310 S Barrett Ave
- 624 W Crawford St
- 618 W Crawford St
- 609 W Owings St
- 626 W Crawford St
- 626 W Crawford St Unit 101
- 626 W Crawford St Unit 102
- 626 W Crawford St Unit 202
- 614 W Crawford St
- 630 W Crawford St
- 622 W Owing St
- 618 W Owings St
- 618 W Owing St