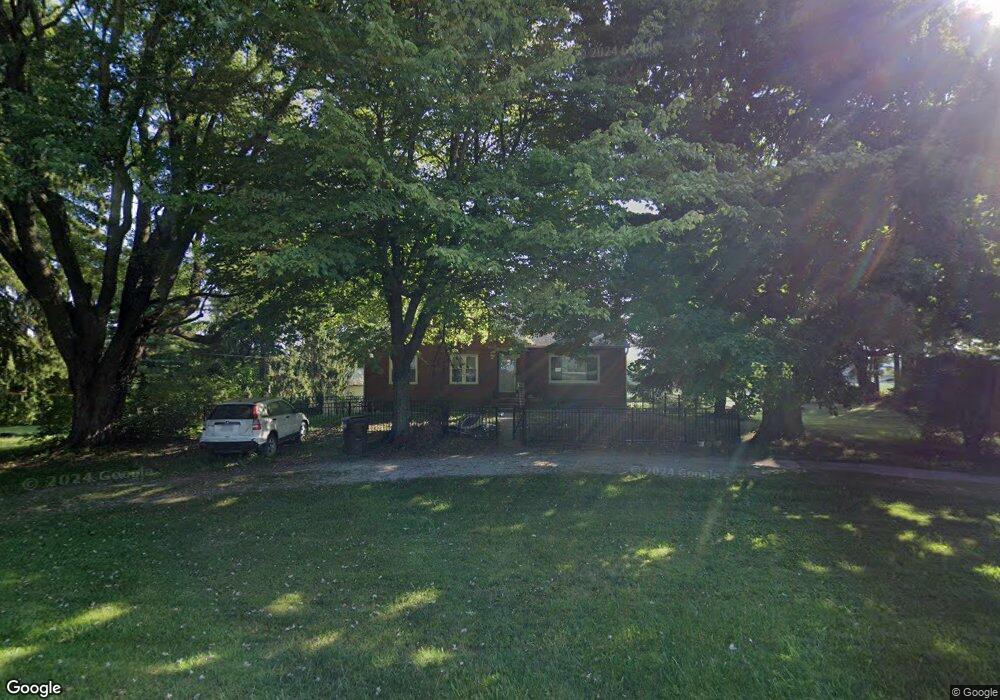
6230 Lithopolis Rd Carroll, OH 43112
Bloom NeighborhoodEstimated Value: $329,000 - $358,932
3
Beds
2
Baths
1,526
Sq Ft
$226/Sq Ft
Est. Value
About This Home
This home is located at 6230 Lithopolis Rd, Carroll, OH 43112 and is currently estimated at $344,483, approximately $225 per square foot. 6230 Lithopolis Rd is a home located in Fairfield County with nearby schools including Bloom Carroll Primary School, Bloom Carroll Intermediate School, and Bloom-Carroll Middle School.
Ownership History
Date
Name
Owned For
Owner Type
Purchase Details
Closed on
Jun 6, 2016
Sold by
Howard Brian R and Howard Shannon E
Bought by
Lascola Christopher A and Lascola Elizabeth A
Current Estimated Value
Home Financials for this Owner
Home Financials are based on the most recent Mortgage that was taken out on this home.
Original Mortgage
$160,800
Outstanding Balance
$126,617
Interest Rate
3.66%
Mortgage Type
New Conventional
Estimated Equity
$217,866
Purchase Details
Closed on
Jun 21, 2010
Sold by
Krouse Harry C and Krouse Sarah E
Bought by
Howard Brian R and Howard Shannon E
Home Financials for this Owner
Home Financials are based on the most recent Mortgage that was taken out on this home.
Original Mortgage
$165,176
Interest Rate
4.6%
Mortgage Type
VA
Purchase Details
Closed on
Feb 18, 1997
Sold by
Chalfant Richard B
Bought by
Krouse Harry C and Krouse Sarah E
Create a Home Valuation Report for This Property
The Home Valuation Report is an in-depth analysis detailing your home's value as well as a comparison with similar homes in the area
Home Values in the Area
Average Home Value in this Area
Purchase History
| Date | Buyer | Sale Price | Title Company |
|---|---|---|---|
| Lascola Christopher A | $178,800 | First Ohio Title Insurance | |
| Howard Brian R | $159,900 | Real Living Title | |
| Krouse Harry C | $135,000 | -- |
Source: Public Records
Mortgage History
| Date | Status | Borrower | Loan Amount |
|---|---|---|---|
| Open | Lascola Christopher A | $160,800 | |
| Previous Owner | Howard Brian R | $165,176 |
Source: Public Records
Tax History
| Year | Tax Paid | Tax Assessment Tax Assessment Total Assessment is a certain percentage of the fair market value that is determined by local assessors to be the total taxable value of land and additions on the property. | Land | Improvement |
|---|---|---|---|---|
| 2025 | $7,105 | $100,650 | $35,350 | $65,300 |
| 2024 | $7,105 | $86,230 | $22,800 | $63,430 |
| 2023 | $3,651 | $86,230 | $22,800 | $63,430 |
| 2022 | $3,679 | $86,230 | $22,800 | $63,430 |
| 2021 | $2,939 | $62,260 | $18,240 | $44,020 |
| 2020 | $2,971 | $62,260 | $18,240 | $44,020 |
| 2019 | $2,980 | $62,260 | $18,240 | $44,020 |
| 2018 | $2,316 | $45,160 | $15,320 | $29,840 |
| 2017 | $2,182 | $48,960 | $14,590 | $34,370 |
| 2016 | $2,150 | $48,960 | $14,590 | $34,370 |
| 2015 | $2,073 | $45,900 | $14,590 | $31,310 |
| 2014 | $1,989 | $45,900 | $14,590 | $31,310 |
| 2013 | $1,989 | $45,900 | $14,590 | $31,310 |
Source: Public Records
Map
Nearby Homes
- 7195 Alspach Rd NW
- 10 Mount Zion Rd NW
- 6985 Royalton Rd SW
- 1925 Wilshire Ln NW
- 3510 Kauffman Rd NW
- 512 N Wooster Way NW
- 7835 E Ohio State Ln NW
- 1809 W Glenhurst Dr NW
- 7545 Royalton Rd SW
- 8547 Heather Lake Dr NW
- 681 Mount Zion Rd SW
- 8245 Royalton Rd SW
- 8143 Royalton Rd SW
- 3355 Old Columbus Rd NW
- 2155 Carroll-Southern Rd NW
- 8890 Lithopolis Rd NW
- 3076 Lithopolis Rd NW
- 8642 Water St
- 52 W Canal St
- 61 Highland St
- 6230 Lithopolis Rd NW
- 6250 Lithopolis Rd
- 6250 Lithopolis Rd
- 6210 Lithopolis Rd
- 6210 Lithopolis Rd NW
- 6245 Lithopolis Rd
- 6190 Lithopolis Rd
- 6190 Lithopolis Rd NW
- 6205 Lithopolis Rd
- 6290 Lithopolis Rd
- 6160 Lithopolis Rd
- 6285 Lithopolis Rd NW
- 6285 Lithopolis Rd
- 6147 Lithopolis Rd NW
- 6310 Lithopolis Rd
- 6147 Lithopolis Rd
- 6269 Lithopolis Rd
- 6269 Lithopolis Rd
- 6137 Lithopolis Rd
- 6320 Lithopolis Rd NW
Your Personal Tour Guide
Ask me questions while you tour the home.