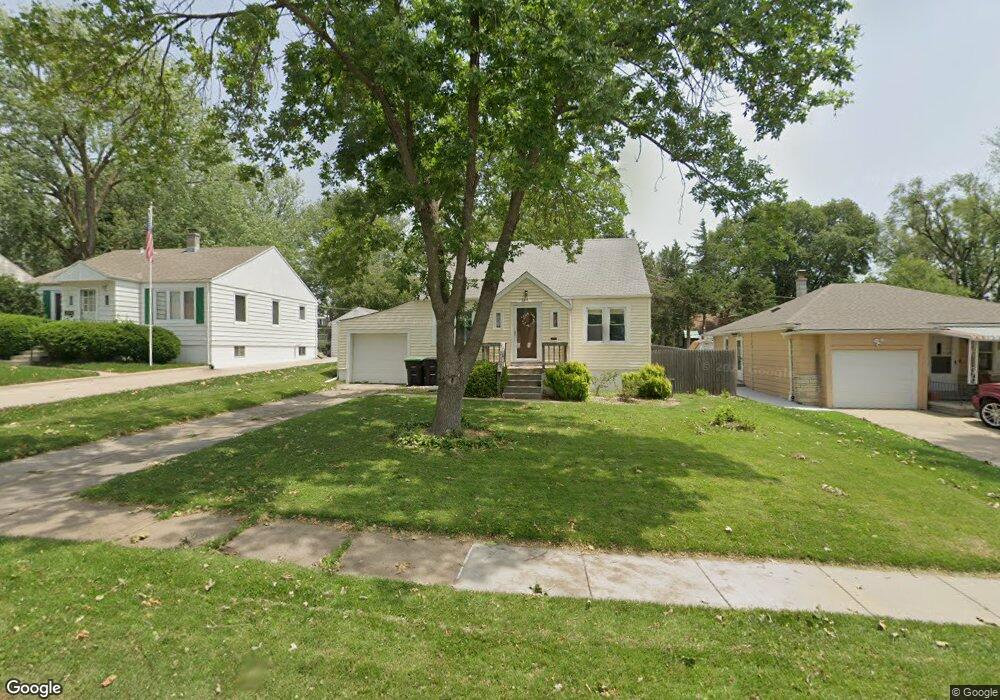
6231 S 39th St Omaha, NE 68107
South Central Omaha NeighborhoodEstimated Value: $191,450 - $227,000
2
Beds
1
Bath
1,090
Sq Ft
$194/Sq Ft
Est. Value
About This Home
This home is located at 6231 S 39th St, Omaha, NE 68107 and is currently estimated at $211,113, approximately $193 per square foot. 6231 S 39th St is a home located in Douglas County with nearby schools including Gateway Elementary School, Bryan High School, and Sts. Peter and Paul School.
Ownership History
Date
Name
Owned For
Owner Type
Purchase Details
Closed on
Oct 3, 2016
Sold by
Schneiderwind Kyle J and Schneiderwind Ashley
Bought by
Swanson Lauren
Current Estimated Value
Home Financials for this Owner
Home Financials are based on the most recent Mortgage that was taken out on this home.
Original Mortgage
$113,050
Outstanding Balance
$90,631
Interest Rate
3.46%
Mortgage Type
New Conventional
Estimated Equity
$120,482
Purchase Details
Closed on
Jun 13, 2013
Sold by
Schneiderwind Kyle and Schneiderwind Stephen J
Bought by
Schneiderwind Kyle J
Home Financials for this Owner
Home Financials are based on the most recent Mortgage that was taken out on this home.
Original Mortgage
$87,400
Interest Rate
3.54%
Mortgage Type
New Conventional
Purchase Details
Closed on
Dec 9, 2005
Sold by
Ewer Deric
Bought by
Schneiderwind Kyle
Create a Home Valuation Report for This Property
The Home Valuation Report is an in-depth analysis detailing your home's value as well as a comparison with similar homes in the area
Home Values in the Area
Average Home Value in this Area
Purchase History
| Date | Buyer | Sale Price | Title Company |
|---|---|---|---|
| Swanson Lauren | $119,000 | Ambassor Title Services | |
| Schneiderwind Kyle J | -- | American Title Inc | |
| Schneiderwind Kyle | $99,000 | -- |
Source: Public Records
Mortgage History
| Date | Status | Borrower | Loan Amount |
|---|---|---|---|
| Open | Swanson Lauren | $113,050 | |
| Previous Owner | Schneiderwind Kyle J | $87,400 |
Source: Public Records
Tax History Compared to Growth
Tax History
| Year | Tax Paid | Tax Assessment Tax Assessment Total Assessment is a certain percentage of the fair market value that is determined by local assessors to be the total taxable value of land and additions on the property. | Land | Improvement |
|---|---|---|---|---|
| 2024 | $3,388 | $168,700 | $13,800 | $154,900 |
| 2023 | $3,388 | $160,600 | $13,800 | $146,800 |
| 2022 | $2,658 | $124,500 | $11,000 | $113,500 |
| 2021 | $2,635 | $124,500 | $11,000 | $113,500 |
| 2020 | $2,257 | $105,400 | $11,000 | $94,400 |
| 2019 | $2,085 | $97,100 | $11,000 | $86,100 |
| 2018 | $2,088 | $97,100 | $11,000 | $86,100 |
| 2017 | $1,800 | $83,300 | $7,000 | $76,300 |
| 2016 | $1,787 | $83,300 | $7,000 | $76,300 |
| 2015 | $1,764 | $83,300 | $7,000 | $76,300 |
| 2014 | $1,764 | $83,300 | $7,000 | $76,300 |
Source: Public Records
Map
Nearby Homes